The measure of the stiffness of a material is termed the modulus of elasticity. It is the ratio of stress per unit of area to the deformation per unit of length.
E = Stress = Force x Length
Strain Area x Extension
It is a number indicative of stiffness, not of strength, and only applies to conditions within the elastic limit. It is nearly the same whether derived from compression tests or from tension tests.
A large modulus indicates a stiff material.
I will be doing two different experiments. The first experiment I will do is called the sag experiment. With this experiment I will be able to find many different things, like the modulus of elasticity for different materials, bending stress, the energy stored as it deforms etc. .
The second experiment I will do is the compound pendulum, with this I will be able to work out the time period, and see if there is a relationship between the sag and time period.
ROUGH TRIALS METHOD:
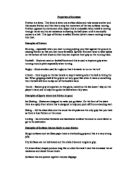
For my first rough experiment I experimented sag. I set up the experiment which is shown under the heading ‘rough trials apparatus 1’. I first put two stands on a table and attached the clamps to the ruler so that 0.05 meters of the rule at both ends were covered. I then put a stand which was holding another rule attached by a clamp in the middle of the horizontal rule; this is to measure the amount of deflection. Then I put some string around the middle of the horizontal rule, this is to allow me to attach the weights.
Once the experiment was set up I started to take measurements. I recorded the height of the rule without any weights added, I then added 100 grams and took down the difference in the level of deflection. I repeated this until 10 times 100 gram weights had been added.
I also measured the weight of the horizontal rule, the width and thickness.
PROPLEMS WITH EXPERIMENT:
I had quite a few problems with the way I set my experiment up:
- It was difficult to get my horizontal rule level as the clamps which were used to hold the rule were not clamped at the same height compared to each other. It took awhile to get them level and still there may have been a few millimetres or centimetres of difference.
- I also found that the rule was slipping from the clamp when the weights were applied. This also makes the rule much harder to bend than where the pieces were held together. This results in the stiffness of the material to be increased.
- Once some weights were added the set up looked unstable and dangerous as the rule started to twist. This could have been because the clamps were no tightened at the same strength.
- Once the weights were added, the level of deflection appeared to be different. This was probably because I had to get up to get the weights and the position of myself and the vertical rule change. This could result in inaccurate results.
HOW TO RESOLVE PROBLEMS:
- Instead of clamps to hold the rule, I shall use two equally level objects (e.g. tables) to hold the rule. This would also make it quicker to change the distances as the two objects would just need to be moved closer.
- If the rule was securely glued together they would no longer slip, but the tendency to do so would exist just the same. This problem could be fixed if the rule wasn’t held down but rather on top of two equally level object.
- As the clamps used to hold the rule will no longer be used, the problem should be resolved.
- I will not move when I am placing the weights on the rule and recording my results. I shall do this by keeping the weights near.
ROUGH TRIALS METHOD 2:
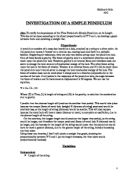
For my second rough experiment I did the compound pendulum experiment. I set up the experiment which is shown under the heading ‘rough trials apparatus 2’. I first put a rule on the side of a table. This was used to measure the distance the swinging rule was held out at, (0.2 meters). I then got another rule which had three holes drilled into it (at the points 0.05 meter, 0.1 meter and 0.15 meters). Then I attached a clamp to a stand. Using a nail small enough to fit through the drilled holes I put it through the first hole and attached the end of the nail to the clamp holding the stand. I put the clamps holding the rule which could then swing at the middle point of the horizontal rule (0.5 meters). The stand was placed at the edge of the table so that the meter rule was allowed to swing.
Once the experiment was set up I started to record measurements. I recorded the time (using a stop clock) for if to take 20 oscillations. I repeated it five times and then changed the holes in which the nail went through and redid the measurements. The length taken for the results were the difference between the hole and the centre of the whole rule. (X2 on diagram ‘rough trials apparatus 2’).
PROPLEMS WITH EXPERIMENT:
I had quite a few problems with the way I set my experiment up:
- When the rule was swinging, it sometimes rubbed the side of the table causing the rule to slow down. This will definitely affect my final results.
- The nail used to go through the holes was not small enough and could have caused friction between the nail and the material causing it to slow down.
- The stop watch might not have exactly been stopped at the point of 20 oscillations.
- The distance the rule was moved to be ready for the swing was 0.2 meters. This could have not been accurate for each experiment as I had moved and so the position may seem the same but in fact be different.
- Using only three holes will not allow me to draw accurate conclusions as it is only three different lengths.
HOW TO RESOLVE PROBLEMS:
- I will use a longer nail so that the rule will be kept further away from the table, this should eliminate friction through rubbing.
- Firstly I shall get a nail and based on the size of it, drill holes into the meter rule so that it fits easily and properly.
- This will be difficult to fix as it is down to human error. So the best way to resolve this will be to pay as mush attention to the experiment in action as possible.
- I will stay at the same point to complete this experiment and record results. This should mean that the position in which I let go of the rule will be similar throughout the whole experiment.
- I will drill five holes at the points 0.05, 0.1, 0.15, 0.2, 0.25 meters. This should result in enough data to draw accurate conclusions from.
APPARATUS FOR EXPERIMENT 1 (SAG):
- Clamps
- 2 meter length wood rulers, 1 meter length metal and 1 meter length plastic ruler
- Stand
- 2 equally level tables
- Weights (N)
- Wire or String
- Dynamic trolley
APPARATUS DIAGRAM:
- Nail
- Clamp
- Stand
- Tape
- Stop clock
- 2 wooden rulers, 1 with 5 holes that shall be made big enough so that the nail can fit comfortably through. The holes will be drilled at the 0.05, 0.10, 0.15, 0.20 and 0.25 meter points.
METHOD:
I will be doing two experiments:
- Sag experiment
- Compound pendulum experiment
In my first experiment I aim to find out how weight and length affect sag. I will only change one variable at a time. I shall do this by setting up an experiment as seen on the apparatus diagram 1.
First I will attach the clamp to the stand and then the wooden meter rule. This will be used to measure the sag when weight is applied. Then the equally level tables will be moved so that 0.05 meters of either the wooden, metal or plastic rule of both ends of the rule will be covered (X value on diagram represents the covered length). The stand will be moved to the middle of the hanging rule ready to take measurements. I will then apply string around the middle of the rule. Measurements of the height without any weight will be then taken. One Newton weight will be hung around the string and the difference between the original and new deflection will be taken, then a second weight will be added and the new total deflection measured.
After ten weights are applies and the level of deflection are taken I will change the length variable by moving the tables so that 0.1 meters of the rule will be covered and then redo the measurements. I shall decrease the length of the ruler by 0.05 meters each time about five times.
The experiment will be repeated two more times using different meter length rulers.
For my second experiment I will only use the wooden rule as the pendulum. The experiment shall be set up as seen as on the apparatus diagram 2. I will stick a rule to the side of the table as seen on the apparatus diagram 2. I shall then join the stand to the clamp. Once I have acquired my rule with the holes drilled through it I will put the nail through the hole at the .05 meter point. The nail will then be clamped to the stand.
I will the get my stop clock. I will then move my rule 0.2 meters as seen in the diagram and release it to that it starts to swing. I will then record the time taken for 20 oscillations using the stop clock and take down the times. I shall redo the experiment for each length 5 times to get a better average. I will then move the nail to the next hole and do the experiment again.
X2 on the graph is the point from the nail to the centre of the rule which is the length of the rule.
Health and Safety
Safety is very important in the experiment as certain objects or procedures can be dangerous and can also affect the results. Nothing is particularly dangerous during my experiment. However, I have to ensure that all the equipment is set up properly and that all things are clamped or tied together. This involves checking things like the connection between the nail and the clamp in experiment 2 as well as the retort stand. The stand itself was clamped to the desk to ensure it didn't fall over. In experiment 1 I have to make sure that when the weights are added to the string or wire, that it doesn’t cause the object to break as that could be dangerous.
Fair Testing (Accuracy and precision)
To get an accurate set of results from this experiment it has to be fair. Here are the steps I will take to make the experiment as fair as possible.
For experiment 1:
- I will make sure the horizontal ruler is straight and not bent as this would cause readings to be read incorrectly.
- That the weights are added on the middle of the rule.
- To make sure that I do not move when I am taking the readings so that I get the correct results as much as possible.
For experiment 2:
- Length of the rule range from 0.25m to 0.45m (measured at regular 0.05m intervals).
- Timing of oscillations of the pendulum should be taken carefully.
- The same rule will be used throughout the experiment, so that mass and width etc. will remain constant.
- Displacement of the pendulum: This will remain constant at 0.20 meters.
- Air resistance: It is assumed that there is no air resistance and 100% of gravitational potential energy is converted to kinetic energy, and vice versa.
ANALYSIS/EVALUATION:
Experiment 1:
Wood: the rule I used had a width of 0.027m and a thickness of 0.006m
When the distance between the supports increased the sag also increased, but not in a proportional way. As you can see, my graph produced a curve and this was due to the bonds in the wooden rule reaching it elastic limit.
As the weight increased, the bonds expand. When the length gets to 0.75M some of the bonds have started to reach there elastic limit. When bonds reach their elastic limit and the weight is taken of they do not return to their original size, making the weight being added have more effect on the structure.
Based on my graph where only 0.98N were attached to the centre of the rule, as the length increased the sag also increased and it produced a straight line which proved that the reason it curved when more weights were added was due to its elastic limit.
To workout bending stress and bending modulus I shall use the formulas:
Bending stress = 3PL Bending modulus = PL³
2wt² 4wt³y
Where P = normal force, L = beam length, w = beam width, t = beam thickness, y = deflection at load point.
Therefore, bending stress = 3(9.8)(0.9)/2(0.027)(0.006²) = 1.36 x10⁷
and bending modulus = (9.8)(0.93)/4(0.027)(0.0063)(0.02) = 1.53 x10¹⁰
Using the formula: WL
3E = x
bd3
Where W = weight or force, L = length, E = modulus of elasticity, b = width, d = thickness.
With this formula I can work out the modulus of elasticity.
To put the formula in the form y = mx I rearranged it so that x = L/3E/bd3 . W
where the gradient(m) = L/3E/bd3 .I then drew a graph of sag (or extension) against force.
According to the graph the gradient = (0.02 – 0.002)/(9.8- 0.98) = 2.04 x 10⁻³
Therefore L/3E/bd3 = 2.04 x 10⁻³ which implies E = [L/m bd3]/3 =
0.9…………………
2.04 x 10⁻³(0.027)(0.0063) = 2.52 x 10¹⁰
3
To work out the maximum surface stress I shall use the formula:
3dEt
2l²
Where d = deflection of the beam at the load, E = modulus of elasticity, t = beam thickness, l = beam length
Therefore maximum surface stress = 3(0.02)(2.52 x 10¹⁰)(0.006)/2(0.9)² = 5.6 x 10⁶
Metal : the rule I used had a width of 0.03m and a thickness of 0.002m
When the distance between the supports increased the sag also increased, but not in a proportional way, just like in the wood. The reason it curved was just like the reason the wood curved, this was because the bonds were reaching its elastic limit.
The bonds in the wooden rule started to reach their elastic limit at about 0.75m, the bonds in the metal rule some of the bonds started to there elastic limit at about 0.70M. The sag at the point when the elastic limit was reached for the metal rule was about 0.01m, whereas the sag point when the elastic limit was reached for the wooden rule was about 0.0015. This shows that the wooden rule has a lower elastic limit compared to the metal one.
To workout bending stress and bending modulus I shall use the formulas:
Bending stress = 3PL Bending modulus = PL³
2wt² 4wt³y
Where P = normal force, L = beam length, w = beam width, t = beam thickness, y = deflection at load point.
Therefore, bending stress = 3(9.8)(0.9)/2(0.03)(0.002²) = 1.1 x10⁸
and bending modulus = (9.8)(0.93)/4(0.03)(0.0023)(0.05) = 1.48 x10¹¹
Using the formula: WL
3E = x
bd3
Where W = weight or force, L = length, E = modulus of elasticity, b = width, d = thickness.
With this formula I can work out the modulus of elasticity.
To put the formula in the form y = mx I rearranged it so that x = L/3E/bd3 . W
where the gradient(m) = L/3E/bd3 .I then drew a graph of sag (or extension) against force.
According to the graph the gradient = (0.05 – 0.005)/(9.8- 0.98) = 5.102 x 10⁻³
Therefore L/3E/bd3 = 5.102 x 10⁻³ which implies E = [L/m bd3]/3 =
0.9…………………
5.102 x 10⁻³(0.03)(0.0023) = 2.45 x 10¹¹
3
To work out the maximum surface stress I shall use the formula:
3dEt
2l²
Where d = deflection of the beam at the load, E = modulus of elasticity, t = beam thickness, l = beam length
Therefore maximum surface stress = 3(0.05)(5.102 x 10¹⁰)(0.002)/2(0.9)² = 4. 7 x 10⁹
Plastic: the rule I used had a width of 0.03m and a thickness of 0.003m
When the length was 0.9m, I was unable to load more that 3.92N as the rule broke.
However, when the length of the rule was shortened, I was able to add more weight without the rule breaking. I also noticed that the level of sag didn’t get affected as much when the length was shorter.
To workout bending stress and bending modulus I shall use the formulas:
Bending stress = 3PL Bending modulus = PL³
2wt² 4wt³y
Where P = normal force, L = beam length, w = beam width, t = beam thickness, y = deflection at load point.
Therefore, bending stress = 3(3.92)(0.9)/2(0.03)(0.003²) = 1.96 x 10⁷
and bending modulus = (3.92)(0.93)/4(0.03)(0.0033)(0.29) = 3.04 x 10¹⁰
Using the formula: WL
3E = x
bd3
Where W = weight or force, L = length, E = modulus of elasticity, b = width, d = thickness.
With this formula I can work out the modulus of elasticity.
To put the formula in the form y = mx I rearranged it so that x = L/3E/bd3 . W
where the gradient(m) = L/3E/bd3 .I then drew a graph of sag (or extension) against force.
According to the graph the gradient = (0.2823 – 0.0403)/( 6.86 - 0.98) = 0.04115.
Therefore L/3E/bd3 = 0.04115.which implies E = [L/m bd3]/3 =
0.5…………………
0.04115(0.03)(0.0033) = 5 x 10⁹
3
To work out the maximum surface stress I shall use the formula:
3dEt
2l²
Where d = deflection of the beam at the load, E = modulus of elasticity, t = beam thickness, l = beam length
Therefore maximum surface stress = 3(0.29)(5 x 10⁹)(0.003)/2(0.9)² = 8.06 x 10⁶
The Young’s modulus for:
Wood = 2.52 x 10¹⁰
Metal = 2.45 x 10¹¹
Plastic =5 x 10⁹
This tells me that metal is the most stiff material with wood second and plastic last.
CONCLUSION:
I think my investigation went pretty well. I am very pleased with the results I gained because they had shown me a good trend/pattern which I could refer to.
Experiment 1:
My graphs showed me a good set of results. My graph had a straight line of best fit which represented the results gained. The graph had a straight line travelling diagonally upwards towards the right, this is because as the force of the weight increased the depression of the ruler also increased, and this is due to Hooke’s law. I drew a curved line of best fit for when the force used way 9.8N; this was because of elastic limit which is explained in analysis. There were some irregular results gained from some of my graph, but they were not seriously out of line from the best fit. These could have occurred from a number of errors:
- The recording of sag may have been taken incorrectly.
- The length of the rule may not have been exactly correct, as all I did was lay it on the table therefore it could have moved when I was adding weights or not been place accurately.
- Random error: These are associated with nearly all measurements and can never be completely eliminated.
- I measured the sag with another meter rule and it was hard to get accurate data from and it showed millimetres but when the length of the horizontal rule became shorter it sometimes took several weights to read 1 millimetre.
I think the procedure I used was quite suitable for this experiment. I varied the force of the weight greatly from 0.98N to 9.8N which gave me reasonable results which I could draw conclusions with. I could have repeated the experiment several times and drawn an average; this would have helped me get more accurate results.
I could have improved my procedure for this experiment by using more accurate equipment such as right angle triangle rulers. I could have also varied the force of the weight bit more to see if the ruler reached a point where it would stop depressing and stay the same position, this is especially true for the plastic material and it snapped when 1 extra weight was added, if I used less heavier weights I could have seen the elastic limit in more detail and drawn graphs and conclusions based on them.
I think my results were quite reliable. There were a quite a few problems which affected my results. The fact that we couldn't stop the weights hanging on the piece of string swaying side to side hindered our results. The main problem was Hooke's law. As the force of the weights increased the ruler begins to stretch the atoms in that wood move apart in a regular way so that the extension of the ruler doubles each time that the force doubles. As the wire continues to stretch, the atoms in the wood move even further apart. As soon as the elastic limit is reached, the layers of the atoms slide over one another, and the length of the ruler increases rapidly. Once the force is removed from the wire, the wire does not return to its original position. This affected my results and meant that I got curved graphs instead of straight line graphs.
I think the results I gained from this experiment were sufficient enough for me to come to a formal conclusion. The results prove that the extension of the rulers depend upon the force of the weight.
I could have tested shorter lengths, this would have allowed me to really see if the pendulum and sag has any similarities when the length was constant.
Experiment 2:
My graph of time period² against length showed me a straight line, if the value at 0.25m is ignored. The reason for that anomaly could be because of a number of things:
My graph had a straight line of best fit which represented the results gained. The graph had a straight line travelling diagonally upwards towards the right, this is because as the force of the weight increased the depression of the ruler also increased, and this is due to Hooke’s law. I drew a curved line of best fit for when the force used way 9.8N; this was because of elastic limit which is explained in analysis. There were some irregular results gained from some of my graph, but they were not seriously out of line from the best fit. These could have occurred from a number of errors:
- Measurement of time: Human error as well as reaction times can make a large contribution to any errors in the experiment. Readings from digital stopwatches are accurate to the nearest 0.01s but human error means this reading is unlikely to be accurate.
- Size of the displacement: This was 0.2m. Each measurement has an absolute error of ±0.5 centimetre as each measurement is given to the nearest centimetre.
- Mistakes can be made when making measurements or when choosing the moment start/stop the stopwatch as the rule is released and stopped. This can cause errors, especially if the pendulum is swinging quickly.
- Random error: These are associated with nearly all measurements and can never be completely eliminated.
- Friction between the hole and the nail as well as the table and the rule. Sometimes the rule swung diagonally and might have rubbed the table.
- Air resistance, I did the experiment near some windows and this could have affected the experiment.
I could have carried out some further work on this investigation to extend and broaden my results for example; I could have done more lengths. I repeated the experiment several times and am happy with the averages I got.
A more sophisticated experiment would definitely increase the accuracy in the timings. Light gates would remove the error caused by reaction times as they will accurately time the moment the rule passed over the point to complete an oscillation.