Energy transfer:
L
Ө
The gravitational potential energy of the object gained at the top of the slope transfer to the gravitational potential energy of the object at the bottom, the kinetic energy at the bottom of the ramp and the work done against friction.
→ Ept = Epb + Ekb + W.D
Change the angle Ө, will also change the gravitational potential energy of the object gained at the top of the slope, therefore the kinetic energy at the bottom and the friction will be different.
Determining the work done against friction:
mgcos Ф
f = μ R
mgsin Ф
O
mg
Ф
From the diagram above I known when the block just slides, the components of weight parallel to the slope should be equalled, which means:
mgsin Ф = μ R = μ mgcos Ф
I can determine the angle which the block just slides, do this by gradually increase the angle(about 1 second 5 degrees). Then I can get a angle Ф when the block just slides by putting a big protractor beside the wood ramp(see picture below).
Alternative way to get the angle is by measuring the horizontal and vertical distance of the object to the point O. tanФ = vertical distance / horizontal distance.
Because I have got that excellent equipment which is available in the physics laboratory, It makes the process faster and more accurate, so I will choose my 1st method to do it.
I did 5 time, which give me Ф = 20.0°,21.8°,18.7°,22.2°,19.2°.(all to 3s.f)
And I average those 5 values then gives Ф = 20.4°(to 3.s.f)
∴μ = tan Ф = tan20.4°=0.372 (to 3s.f)
Rearrange the equations:
From the “energy transfer” I got a equation:
Ept = Epb + Ekb + W.D
→ Ept = Epb + Ekb + LtanФμ R
→ Ept = Epb + Ekb + LtanФmgcosӨ
→ mg(H+LsinӨ) = mgH + 1/2mv2 + LtanФmgcosӨ
→ v2=2gLsinӨ - 2gLtanФcosӨ
→ v= (2gL(sinӨ - tanФcosӨ))^1/2
Therefore, I had a equation involves velocity, Ө and Ф. As long as I known the Ө and Ф, I will be able to calculate the velocity which the object just leave the slope fall towards the ground.
vh Ө Ө
v vv
H
D
vh = vcosӨ ; vv = vsinӨ
∵ D = vh * t ∴ t = D / vh
Consider the vertical component,
S = ut + ½ ut2 → H = vv t + ½ gt2
→ H = vv D / vh + ½ g D2 / vh2
→ H = vsinӨ D/ vcosӨ + ½ g D2 / v2cos2Ө
→ H = D tanӨ + g D2 / (2 cos2Ө(2gL(sinӨ - tanФcosӨ)))
→ H = D tanӨ + D2 / (4 cos2ӨL(sinӨ - tanФcosӨ))
→ D2 / (4 cos2ӨL(sinӨ - μcosӨ)) + D μ - H =0
(Noticed that, this is a quadratic equation.)
I can calculate the horizontal distance D by substitute the Ө and Ф values in then solve the quadratic equation. This will give me the predicted value of D.
Let 1/(4 cos2ӨL(sinӨ - μcosӨ))=a; μ= tanФ =b; -H=c
The quadratic equation becomes aD2 + bD +c = 0 .
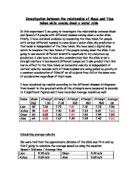
I will produce a table in Microsoft Excel, showing the Ө in degrees, Ф in degrees, L in metres, H in metres and a, b and c.
Then as long as I got the values for a, b and c, because it is a quadratic equation, so I will be able to calculate the value of D by using a formula to find the roots of a quadratic equation:- (-b±(b2-4ac)^(1/2))/2a.
And in this case, I will only need the positive solution of the quadratic equation, which will be give by using the formula (-b+(b2-4ac)^(1/2))/2a.
(The calculations are done by Microsoft Excel, and the calculated values a, b and D are all in 5 decimal places)
The predicted results are shown above, then I am going to draw the graph of “D against L”.
Before that, I did the lower bound and upper bound values for the predicted value of D. I calculated the lower bound by multiplied 0.95, upper bound by multiplied 1.05 because I assume the error is ±5%.
two dotted lines in each graph are lower bound and upper bound respectively.
I will do some comparisons between these model graph and the actual graphs.
The practical element:
The method that will be undertaken is firstly to set up the apparatus as shown in the diagram in “Introduction”. The height above the ground, H, should be measured using a metre ruler and this should be kept constant throughout the experiment. The angle at which the wood ramp is at should also be kept constant and should be held in place by clamps, so that the edge of the slope is parallel with the edge of the plastic box(which the wood ramp is standing on it). A piece of card board should be placed on the floor running away from the plastic box. Practice runs of placing the object at different length on the slope should be done to find roughly the place where the piece of card board should be placed.
For the experiment, the object should be held in place on the ramp at 5 different lengths. 50cm, 40cm, 30cm, 20cm and 10cm to the edge of the slope. It can then be released and as the object strikes the piece card board it should leave a mark on it. The range(distance) can then be measured from the edge of the table to the centre of the mark left by the clear trail. The experiment can then be repeated 3 times for each length on the ramp to reduce the effect of anomalous results.
The experiment will be conducted using H = 0.283m and at a angle 30°to make a start. Then will do 35 and 40 degrees. 5 different lengths for each angle.
This will hopefully obtain a good set of results.
I then got the results as below:
Possible variation:
Unsure surface of the block and the wood ramp varied lost energy;
Twisting affected the energy transfer;
Errors in reading the mark on the piece of card board.
Graph:
I will draw 3 graphs for each angle, then compare them to the model graphs see what the differences are.
For the first and second graphs, Ө=30°and Ө=35°, most part of the ‘actual lines’ lie within the error bounds. However, the last graph Ө=40°, the whole ‘actual line’ is not in the error bounds.
I guess the reason for this is the contact surface between the block and the wood ramp. When the angle is about 35 degrees, there is a best contact of the block to the wood ramp surface, therefore the friction I obtained is very close to the real value in just this case, so my graph for this one is the best in those three. When the angle increased to 40 degrees, the contact of block to the wood ramp might become less, the friction I got would has some error compare to the actual value, this obviously affected the landed distance, so the graph for this looks very odd.
Sources of error:
There must have been some amount of varied friction during the movement of the block moving down the slope. There must also have been air resistance of the block dropping during its trajectory. Both of these were ignored in the calculations. To minimise both types of friction, a dense and smooth object was used as this would lower the affect of both air resistance and resistance with the slope. The slope was also looked at to check that it was smooth and that there were no obstacles or blemishes on the surface to ensure a smooth run.
The ruler was not set exactly vertical throughout the experiment, giving false readings. To try to minimise this, set squares were used to keep the ruler vertical, and clamps were used to try to hold it in place so that it was the same for every attempt.
The object was released in a way that tried to minimise the amount of spin in any direction apart from that of down the slope. Excessive spin or spin in an incorrect direction would alter the acceleration of the object sliding down the slope. To try to avoid this the block was released carefully using a piece of wood to hold it rather than a human hand releasing it,. This meant that it started to slide in the correct way from the start of its descent down the slope.
The piece of card board that was used to make an impression may have moved slightly as the block struck it at an angle. It was either held in place, or sticky-tape was used to ensure that it did not move during impact. Also, to maintain accurate results, the reading was always taken from the centre of the line impression. However, it doesn’t mean that the centre of the line impression is the exactly point the block landed, because it is a block, not only a particle, it has centre of mass, the position of the centre of mass of the block when it landed should be the most accurate point I want, but it is very hard to determine, so I will just take the centre of the line impression to be my reading
The most significant error for my experiment is the value of μ. I obtained it by measured the angle where the block just slides. Human reading for the angle is not very accurate, and the range for those readings is about 3.5°(22.2-18.7), so the percentage error is roughly (3.5/20.4 *100%) 17.2%. It is a huge percentage error. Not only the error in reading the angle, but also the calculation μ = tan Ф, because the angle is in decimal place(not accurate), take the tangent to that angle will increase the error again. If the value of μ is not accurate, then the friction is not perfect as well, from the energy transfer equation, Ept = Epb + Ekb + W.D, the kinetic energy I obtained will be affected by the varied friction, the velocity when the block just leave the slope will change, therefore the distance land will vary.
e.g if the calculated μ is less than the actual value, the work done due to friction is smaller, so the velocity is greater than the actual value, then the landed distance obviously would be further away from the edge than the real landed distance. The graph for this case should lie a bit higher than the true graph.
Percentage error:
The error for the experiment caused by lots of things. Friction measurement, height measurement, length measurement and distance measurement.
Take the accuracy of each measurement and divide by the smallest value I have got for each measurement then times 100% to get the percentage error
The error for angle (Friction): 17.2%
After doing the calculation ,μ = tan Ф, the error increased.
The error for L (Length): 0.001m
Percentage error = 0.001/0.1 * 100% =1.0%
The error for H (Height): 0.001m
Percentage error = 0.001/0.282 * 100% =0.4%
The error for D (distance): 0.001m
Percentage error = 0.001/0.129 * 100% =0.8%
Total percentage error = 17.2% + 1.0%+0.4%+0.8% =19.4%