Modelling
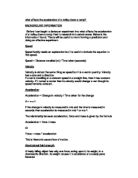
For my first model, I am going to assume that air resistance is neglible, and that the coefficient of friction is 0.
The force diagrams below show that the acceleration should be equal to, where g is the acceleration due to gravity (9.81 ms-1), and θ is the angle that the ramp makes with the horizontal.
The final speed is going to be found by using a light gate and a millisecond timer to record the time it takes for a piece of card attached to the trolley to pass through the light gate. If we know the theoretical acceleration as, then using the equation , we can find the theoretical final velocity, which, as is . If the length of the piece of card is , then using the equation , where v is the average velocity, . However, this gives the time that the trolley would take to pass the light gate if at a constant speed. The fact that the light gate is on the slope means that the average velocity which we are timing is actually , because the trolley is still accelerating. Therefore the theoretical time is ,
As the ramp forms a right-angled triangle, can be calculated using the identity opposite/ adjacent. Therefore,
The table below compares theoretical timings against the real times, using the formula
The theoretical times are all lower then the experimental times, which indicates that there is something wrong with the modelling. To check this, I am going to work backwards to obtain a value for g.
As , , therefore
These values of g are appear to have a trend- however, I am now going to work out the error bounds for g, using the error bounds for t, found earlier.
G is tending to something slightly above 8, as Graph 1 shows. So even if it reaches 8.5 this is an error of nearly 15% on its true value of 9.81. My estimate of experimental errors are as follows:
Timing: accurate, no error (done electronically)
Measurement of x ± 1mm = 0.4 %
Measurement of : = 1.9 %
Measurement of s ± 1mm. For large values of s, < 1%
Therefore, max experimental error is 0.4 + 1.9 + 1 = 3.3%.
This does not explain the discrepancy, as Graph 2 shows, so it must be due to modelling errors.
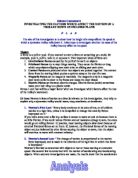
A revised model
To investigate an improved model, I am going to look at the energy balance.
As the average velocity at the light gate is , then using , the kinetic energy can be expressed as .
As , the gravitational potential energy lost is .
As there is obviously some frictional force, the work done against friction is the energy lost, or in symbols: . Therefore, we can find the frictional force using Energy = Force x distance, so then the frictional force, F is .
An average value for the frictional force F, is 0.1283
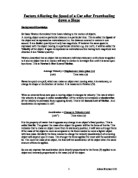
Conclusion
The original model of ignoring friction was not satisfactory. There clearly is resistance, as shown above. The resistance is not constant, however it seems to be greater at low speeds. A revised model could include a resistance force of 0.1N. This would be better but still not particularly accurate.
Further investigation would be needed to give more information about the frictional force. A better method would be to release the trolley with a electromagnet, which starts one millisecond timer, and allow the light gate to stop one millisecond timer, but start another, as in the experiment. This would mean that the error in releasing the trolley is less, and constant, and that there are two times, so there are actually two sets of data that can be compared against the results.