SCIENTIFIC THEORY:
The higher the slope is there will be more potential energy the car will have. Because the car will go down faster and it will gains more speed because it has more energy.
And if there were more potential energy there would be more kinetic energy.
APPARATUS:
We used the following equipments for the experiment:
- A model car
- Ticker- timer (Each time a paper goes through it holes 50 dots per second)
- A see-through celllotape
- 5 books
- 4 Strips of paper
- We had to make a slope using a cardboard paper
This is how the experiment looked like:
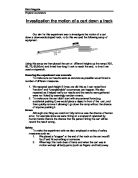
METHOD:
When we started the experiment I had to place 5 books on top of each other in a pile.
Then we had to place the ticker timer on the top of the books, after I have done that the teacher placed the slop that looks like a hill going downwards made by a cardboard paper.
I used a ruler to measure the height of the slope because each time when you remove a book you will need to measure the height.
Each time the car goes down the switch of the ticker timer will have to turn on the switch and when its finished I will have to switch it off.
When the car goes down the ticker timer will place dots on the paper, which makes hole through the ticker timer.
First of all we got 5 books and we made a pile. Then we put the ticker- timer on top of the pile.
After doing that we removed one book and done the whole procedure again and for this experiment we used the lab safety procedure.
I think that the result in this experiment are showing that the steeper the slope was the faster the car was accelerating.
I will place all my results in a table and there will be a section for heights for each experiment and the potential energy for each experiment.
I have placed the results in a scatter graph, which is shown below.
Here are the results:
No: 1
Height = 35 cm
D = distance
Here is a scatter graph for the results:
Here are the results:
No: 2
Height = 31 cm
D = distance
Here is a scatter graph for the results:
Here are the results:
No: 3
Height = 27 cm
D = distance
Here is a scatter graph for the results:
Here are the results:
No: 4
Height = 23 cm
D = distance
Here is a scatter graph for the results:
ANALYSES:
The first part of graph 1 is the steepest, it has low steep in the middle but the steep goes up at the end.
The first part of graph 2 is steepest, because the last part has less steep.
In graph 3 the first part is steep and in the middle there is less steep, the steep goes up at the end.
The last graph that is no 4 the first part is steep but in the middle there is less steep. The steep goes up and then down then it goes back to steep at the end.
CONCLUSION:
My aim has been met and my prediction was right.
The graph shows that the car goes faster when the slope is steeper and it goes slower if the slope is less steep and I really liked doing the experiment.