Prediction
I predict that the more sodium thiosulphate, the faster the black cross will disappear. If the concentration is low, it will take longer for the cross to disappear, making a slower rate of reaction.
Method for Preliminary Experiment
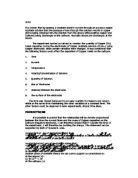
Measuring Beaker and Water Hydrochloric Sodium
Cylinder black cross Acid Thiosulphate
- Set up the apparatus as shown above.
- Fill the measuring cylinder with the correct concentration of hydrochloric acid.
- Pour it into the conical flask.
- Fill a second measuring cylinder with the first concentration of sodium thiosulphate and water.
- Pour into the same conical flask and at exactly the same time, start the stopwatch. This is because it will start to react straight away.
- Stop the stopwatch when the black cross has completely disappeared.
- Because the first concentration will take a long time, wash the measuring cylinders and repeat the experiment in a new beaker with the second concentration.
- Repeat the experiment again using the third concentration.
- Record all results in a table.
Table of Results
Preliminary Experiment Conclusion
I can conclude that my graph isn’t reliable enough because we haven’t got enough results to form a curve or line of best fit. This is mainly because I have used 10% concentration which took too long. Next time, I will use 60%, 70%, 80%, 90% and 100% concentration to make it more reliable – I need more concentration intervals.
Main Investigation
Prediction
My prediction for the main investigation is the same as the preliminary experiment – the more sodium thiosulphate, the faster the rate of reaction will be.
Method for Main Investigation
I decided that I will keep my method the same for the main investigation and the preliminary experiment because the first method worked well, so I don’t need to change anything for the main experiment. I will repeat each concentration three times to make sure my results are reliable.
Table of Results
= Outlier / Anomalous Result
When the concentration of sodium thiosulphate is 60%, the average time taken for the cross to disappear is 63 seconds. When the concentration of sodium thiosulphate is 70%, the average time taken for the black cross to disappear is 50 seconds. The 70% solution decreases the time by 13 seconds, the 80% solution decreases the time by 10 seconds, the 90% solution decreases the time by 5 seconds and the 100% solution decreases the time by another 5 seconds. Every time the concentration increases, the rate of reaction is faster, which means my prediction was correct.
13 seconds 10 seconds 5 seconds 5 seconds
Conclusion
The results I collected from doing this experiment give me evidence that when the concentration of sodium thiosulphate increases, the time taken for the cross to disappear decreases. I tried to find a mathematical link between the results on my graph, but I didn’t have the correct concentrations to find a link. So, instead I drew a straight dotted line linking every two points together. On my graph, I used range bars to make it more accurate. If the range bars are large, the results are less accurate than if the range bars are small. When we did our experiment, we found we had one outlier – an anomalous result, which is a result that doesn’t fit the pattern. See more about anomalous results in the evaluation.
Evaluation
I feel confident with my results. I had only one outlier in the first attempt for the 70% concentration, 35cm3 of sodium thiosulphate. I did not include this anomalous result in the average time because then it would make that one average result unreliable, which would then also make the graph of results unreliable. This outlier could have happened because there could have been a mistake with the amount of sodium thiosulphate, water or hydrochloric acid when I did the main investigation, but this could not be true because I did repeat the 70% concentration three times, all with similar answers. To get this outlier, it could have been because I did this experiment in two different rooms on two different days, and the heat and weather conditions could have changed which probably affected the experiment. Also, the timing may not have been correct because I were watching it with my own eyes. The stopwatch may have been started and stopped at the wrong time – even one second out each time could make the result wrong. To correct this outlier, I repeated the outlier three times but each time, I have the same wrong time. With the one outlier aside, my results are accurate so I am happy with them.
Faults:
- We used different people looking at the experiment with their own eyes. That doesn’t make the experiment accurate.
- We used measuring cylinders to measure the amount of liquid we needed. It isn’t accurate like this because you can’t get the exact amount.
- The temperature was different when we did the experiment – we did part in one room and then did another part in a different room. This makes the experiment less accurate because of the different temperatures.
Improvements:
If I did this experiment again, I would improve my results and make them more accurate by:
- Keeping the same person filling the measuring cylinder with sodium thiosulphate, water and hydrochloric acid so the measurements are exact.
- Having a stopwatch that measured to a thousandth of a second so my results would be accurate
- Adding more concentrations so the curve on the graph is longer. This would give me a better set of results to evaluate.
-
Only doing one experiment at a time so I only have to watch one, not two at the same time. This will ensure that we get the most accurate result we can get because we will be paying attention to the stopwatch for one experiment at a time, not two together.
- Using conical flasks for the mixture instead of beakers – this is because at the beginning of the experiment, we have to swirl the mixture around. This is easier to do in a conical flask instead of a beaker.
- Using burettes instead of measuring cylinders to make the experiment more accurate.
- Doing the experiment in a water bath so the temperature is the same through the experiment
- Using a colorimeter so we know when the cross has disappeared completely, rather than using our eyes which makes it inaccurate.
- If we can, we should use a catalyst so we can have more successful collisions.
Extra Details
Colorimeter:
A colorimeter is a light source going through filter paper, then through the test tube or beaker in our case. The light travels through a light sensitive cell, and then it tells you a reading of how much light is shining through the solution. This tells is when the cross has fully disappeared to give us a more accurate result.
Water Bath:
A water bath is a bath filled with water that we can do the experiment in so the water keeps everything at the same temperature. It is fairer this way because when the temperature is different, the results are less accurate.
Burettes:
Burettes are tall glass tubes filled with the liquid we need. If we fill our measuring cylinders up with burettes, we can ensure that we have the exact amount of the liquid to make it more reliable.
Catalyst:
A catalyst increases the rate of reaction without itself being affected by anything. It lowers the activation energy without changing the energy of the original reactants, meaning more particles can cross the barrier and successfully collide.
Were my predictions correct?
My predictions for both experiments, the preliminary experiment and main investigation, were correct. I said that the higher the concentration of sodium thiosulphate, the faster the rate of reaction would be. I know this because when the concentration is higher, there are more particles to successfully collide and bond together, making the rate of reaction faster. I also know that it would have helped if we used a catalyst because that would make even more particles successfully collide.
Safety
I found out about the hazards of the reactants we are using from Wikipedia (en.wikipedia.org):
Hydrochloric acid Corrosive
Sodium thiosulphate No hazard
Sulfur No hazard
Water No hazard
Sulfur dioxide Corrosive and Toxic
Confidence in Conclusion
Data
I feel confident with my results in my results table. I also feel confident that I have drawn my range bars correctly, although the first one is large which means it is less accurate than the smaller range bars.
Relate Faults to Confidence
I real that my faults from the experiment haven’t knocked my confidence in my results because I know that the faults are just mistakes that I could improve if I did the experiment again. I still feel confident with my results I the results table and my graph.
Further Work
If I had to do this experiment again to try to make it more accurate and my results more reliable, I would use the same method that I used for my main investigation, but add things to make it better. The improved method would be:
- Set up the correct apparatus.
- Ensure that the apparatus is set up correctly, this time using a colorimeter. This will make sure the black cross cannot be seen.
- Using the burettes, fill a measuring cylinder with the correct amount of hydrochloric acid.
- Pour it into the conical flask.
- Using the burettes, fill a second measuring cylinder with the first concentration of sodium thiosulphate and water.
- Pour into the same conical flask and at exactly the same time, start the stopwatch. This is because it will start to react straight away.
- Stop the stopwatch when the black cross has completely disappeared.
- Repeat this concentration three times to make the results reliable.
- When this concentration has been repeated three times, wash the apparatus and repeat the experiment again using the next concentration.
- Make sure all concentrations are repeated three times.
- Record all results in a table.
I think that using a colorimeter and burettes will make the experiment more accurate and the results more reliable. If we plotted another graph after doing this improved experiment in the future, the range bars would be smaller because the results would be a little more accurate.