The Substances pass through the membrane by way of three different processes. These processes are:
- Diffusion
- Osmosis
- Active Transport
Diffusion is the positive movement of molecules or ions from an area of high concentration to an area of low concentration until they are evenly spread. Diffusion occurs commonly during everyday life, for instance when a gas is placed in a room it will diffuse from the area of high concentration, where it is originally placed, to the rest of the room, which was an area of low concentration, until the gas particles are evenly spread throughout the room. Diffusion can occur between liquids and gases. Diffusion always occurs from an area of high concentration to an area of low concentration. The difference between the two areas is known as a concentration gradient.
Diffusion is speeded up by raising the temperature (or Stirring liquids)
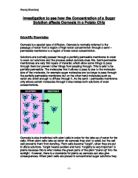
Osmosis is special case of diffusion. Osmosis is the movement of water molecules from an area of high water potential (or concentration) to an area of low water potential through a partially permeable membrane.
Water:
H2O
Small molecule
Easily passes through partially permeable membrane
Glucose
C6H12O6
Big molecule
Cannot pass through partially permeable membrane
A partially permeable membrane allows small molecules to pass through. Water molecules move constantly in both directions; however, more flow to the solution with the lower water potential. This is known as the net flow.
Osmosis occurs in plant cells, allowing plants to transfer water in and out of cells.
Plant cell
Water is allowed in and out of the plant through the partially permeable membrane. The direction of the net flow of water depends on the external water potential in relation to the internal water potential; if the external water potential is higher, water moves into the cell, whereas if the external water potential is lower then water moves out of the cell. We are simulating this by placing the cell (in the potato) in water with high water potential – pure water, and low water potential – a sugar solution.
When a plant cell is placed in water with high water potential the water outside the cell has a higher water potential than the cell itself. This results in water moving into the cell via osmosis, water moving from low water potential to high water potential. The cell expands and becomes turgid. The cell wall prevents the cell from bursting. Turgid cells support plants that are not made of wood.
Plant cell placed in a solution with high water potential
When a plant cell is placed in a sugar solution with low water potential the water potential of the cell is higher than the water potential of the solution. Water moves out of the cell by osmosis, water moving from low water potential to high water potential. The cell looses water and the vacuole shrinks. The cell membrane moves away from the cell wall. This process is called plasmolysis. The cell is now flaccid or plasmolysed. Plants with flaccid cells, i.e. plants that are not getting the required amount of water to keep a cell turgid, cannot support themselves and they wilt.
Plant cell placed in a solution with low water potential
Prediction:
I predict that when the potato chips are immersed in dilute solution, with high water potential, osmosis will occur with a net flow from the solution into the potato cells. The water will enter the cells through the partially permeable membrane and the cell will become turgid. Thus the cell will gain mass.
I predict that when the potato chips are immersed in strong sugar solution with a low water potential, osmosis will occur with a net flow from the potato out into the solution. The water will leave the potato cells out of the partially permeable membrane and the cell will become flaccid. Thus the cell will loose mass.
I predict that when the potato chips are immersed in a solution with equal water potential to the water potential of the internal cell sap then osmosis will not occur. There will be no net flow of water in or out of the cells and the potato will not loose or gain mass.
Preliminary Experiment
For the preliminary experiment we used the maximum and minimum sugar solution concentrations that we were able to, to make sure that osmosis would occur within the amount of time that we had and to allow us to roughly estimate the internal cell sap sugar concentration.
Beakers were decided to be the most practical container as there would be three times less beakers as test tubes as three chips can fit in each beaker whereas only one chip can fit in each test tube and so using test tubes would result in having fifteen tubes for five different concentrations whereas using beakers it would only take five. It is therefore more practical to use beakers rather than a large quantity of test tubes. Also the surface area of the chip resting against the glass of the beaker is the same for every chip as it is just the bottom face of the chip.
The experiment was set up with one beaker containing a solution with 0% sugar concentration and one beaker containing a solution with 20% sugar solution. 60ml of solution was needed to completely immerse the chips. A different syringe was used for handling each solution so as not to alter the sugar solutions of either by using the same syringe for both solutions.
The chips were cut to 3cm in length after being sliced by the potato chipper.
This was because at three centimetres three chips could easily fit inside the beaker.
Table showing the times that the chips were put in and taken out of the solution
Preliminary Experiment Results
Table of preliminary results
Table of the average masses and change in masses of
Potato chips placed in both solutions
= Internal cell sap glucose concentration
Therefore the internal cell sap glucose concentration is approximately 11%. This is a very rough estimate and the exact concentration of glucose will be determined using the results from the main experiment.
It was decided during the prelim experiment that 20 minutes would be an appropriate length of time to leave the chips immersed in the solutions. This is because 20 minutes is long enough for osmosis to alter the weight significantly, if osmosis is to occur, and it is not too long a period of time for the double lessons that we are conducting the experiments in.
Varying Sugar solution strength:
Two different 1000 ml beakers of solutions were given one with 20% sucrose solution and one with water. Two syringes were used when making up the varying concentrations of sucrose solution, one for 20% sucrose solution and one for water. This prevented 20% sucrose solution from getting into the water solution beaker and water from getting into the 20% sucrose solution beaker. Concentrations were made up from 0% to 20% in steps of 5%.
Table showing amounts of water and 20% sucrose solution in various concentrations of sugar solution:
0% Sucrose solution:
4% sucrose solution:
8% sucrose solution:
12% solution:
16% solution:
20% solution:
Results:
Results table
A result highlighted in red means that it is an anomalous result. i.e. 2.98
Analysis:
To be able to draw a graph from the results it was necessary to work the average change in mass for each concentration. This was done by adding up all the initial masses of chip number one, chip number two and chip number three for each concentration and dividing the total by three in order to find the average initial mass. The same was then done with the final masses of chip number one, chip number two and chip number three for each concentration in order to find the final mass. Then the average initial mass was taken away from the average final mass in order to find the average change in mass.
Any anomalies that were collected were not included when this calculation was being worked out due to the fact that the experiment had not worked properly for that chip and thus the results were irrelevant.
Only one anomaly was collected. It was an anomaly because one would have expected a net flow of water from outside of the potato into the potato at that sucrose solution concentration as happened in the other two chips placed in this concentration solution, however osmosis did not occur. We know this because there was no change in mass of the chip. As a result this chip’s results were not included while averages were being worked out.
Table showing average change in mass by the potato chips
Conclusion:
The graph shows that the potato’s internal cell sap concentration is 8 % sucrose.
The graph also shows that when a potato chip is immersed in a dilute sucrose solution with a high water potential the net flow of water flows from outside the chip which has a higher water potential to inside the chip which has a lower water potential.
It also shows that when the potato chip is immersed in a concentrated sucrose solution with a low water potential the net flow of water flows from inside the chip which has a higher water potential to outside the chip which has a lower water potential.
The change in mass during the time that the potato was immersed in sucrose solution was directly proportional to the concentration of sucrose solution. This means that the change in the mass of the potato after it has been immersed in 0% sucrose solution minus the change in mass of the potato after it has been immersed in 4% sucrose solution equals the change in the mass of the potato after it has been immersed in 4% sucrose solution minus the change in mass of the potato after it has been immersed in 8% sucrose solution.
The graph on page 20 illustrates this and shows roughly for every 4% increase in sucrose solution concentration that the chip was immersed in the difference in mass from before the chip was immersed to when it was removed from the solution is greater by 0.05g.
All of these facts support my prediction thus showing that my prediction was correct. The graph also shows the same correlation to my preliminary graph, however the internal cell sap concentration of sucrose in the potato was different. The preliminary experiment showed that the internal cell sap concentration of sucrose in the potato was 11% whereas the actual experiment showed that the internal cell sap concentration of sucrose in the potato was 8%. The actual experiment is more accurate as it gives a greater range of results which provide more points from which to draw a line of best fit. This ensures that the line of best fit in the actual experiment is closer to the actual average change in mass as it is drawn as close as possible to all of the points and not just two. Thus the point where there is no change in mass is closer to the actual sucrose solution concentration than it was in the preliminary experiment.
Furthermore the potato used for each experiment was different and all potatoes have different sucrose concentrations, which also explains the difference in the two results.
Evaluation:
The procedure allowed me to find out the internal concentration of cell sap glucose in a potato. It provided me with three repeats so that a reliable average could be taken. Averages are more reliable than using one result as they take into account variation between results.
Table showing the variation between results
Anomalies were included when working out the variation between results seeing as any anomalous results were produced by the experiment and are therefore part of the variation between results produced by the experiment. The average variation between results is 0.05g. The greatest variation between results is 0.09g. Therefore using one result is inaccurate as it varies up to ±0.09g and on average by ±0.05g from when a repeat of the same concentration is conducted.
Taking an average of several results creates a measurement in the middle of the variation created by the experiment, which is the result that is closest to the change in mass that a chip would experience in an experiment that was totally accurate.
In this experiment variation was created by several things that could have caused inaccuracies:
- The scales only measure to two decimal places and therefore are only accurate to ±0.005g. When measuring a change in mass that is under 0.1g, sometimes as small as 0.01g, a ±0.005g variation is quite considerable. If the change in mass is 0.01g, 0.005g is 50% of that.
-
Human error means that when measuring out the concentrations using the syringes they could have been slightly larger or smaller than the volume that they were supposed to be, which could have affected the concentration of sucrose solution. The syringes were very large and bulky and it was difficult to be sure that the volume of liquid was exact and not ±0.5cm³ of the desired volume.
- When dabbing the chips with a towel an inconsistent amount of water could have been absorbed by the towel each time meaning that the final mass of the chip was altered by a different amount each time.
- Some chips could not have been perfect square prisms:
Therefore chip 2 would have had a bigger surface area than chip 1 which would have left a bigger area open to undergo osmosis which would result in a greater change in mass. It was attempted to prevent this but in some cases this happened slightly as it was not always possible to get a perfectly square chip.
This means the procedure had various short comings. More accurate scales could have been used and the liquids could have been measured out using syringes that were easier to make sure the volumes were exact. More accurate results would also be obtained by dabbing the chips a certain number of times per side using only the weight of the chip to put pressure on the paper towel and then laying the chip on a dry area of towel each time it is dabbed. The chips, as always, would only be handled using forceps.
The fact that there was an average variation of 0.05g between results shows that the experiment is not totally reliable. When measuring a change in mass that is sometimes as small as 0.01g to collect reliable evidence the variation between results needs to be far smaller than 0.05g. This is why I do not think that the experiment is accurate enough to prove that the internal cell sap glucose concentration of the potato was exactly 8%. The results collected prove that if the potato chip is immersed in a solution with a high water potential osmosis occurs with a net flow from outside the potato chip to inside it, and when the potato chip is placed in a solution with low water potential osmosis occurs from inside the potato chip to outside it.
Although the average was taken which does create a higher level of accuracy a larger number of repeats needs to be done in order to discount the variation that is larger than the result that is being measured.
Therefore to prove the exact concentration of glucose in a potato I would like to do at least five repeats per concentration in the future. I would also like to do a greater number of concentrations between 0% and 20%, i.e. 0%,1%,2%,3%,4%,5%,6%,7%..etc. This would provide more points on the graph which would provide a more accurate line of best fit which would provide a more accurate internal glucose percentage.