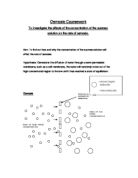
I predict that after the salt solution is equal in consistency to cytoplasm that is in the potato chips cells (after the Salt solution has reached the potatoes isotonic point), the potato chips will start to decrease in mass because the concentration of water is higher inside the cell of the potato chip than it is out side in the salt solution. I predict that the mass of potato chip will increase when the molar of the solution is lower than the isotonic point of the potato because the concentration of water is higher out side the potato cell than it is in side. I will know when I have found the isotonic point of the potato when I leave the potato chip in the solution for the set period of time the percentage change of mass change will be zero. The reason for my prediction is this theory:
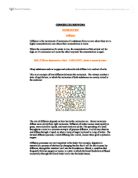
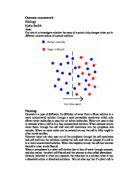
Osmosis is a process that is a special kind of diffusion. It occurs when water moves through a semi-permeable membrane from a region of high water concentration (a dilute solution or just water) to a region of low water concentration (concentrated solution, for example high salt solution). Osmosis only occurs with moving water molecules as they can fit through cell membrane pores whereas dissolved salt molecules for example are too big.
Higher water concentration
Lower water concentration
I carried out these preliminary experiments to find out whether the isotonic point of the potato was between 0 and 1 0r 1and 2 so that I can make my main experiment more precise. I kept the masses of the chips the same and the temperature the same.
Original Mass of he chips: 1.50 grams
Temp of solutions: 17 degrees
Amount of solution: 50 ml
Using these results I can realise that the isotonic point of the potato is equal to a molar solution between 0 and 1 Molar. I know this because the mass of the potato chip increased in the 0M solution and decreased in the 1M solution and its mass decreased by even more in the 2M solution.
Knowing this I am going to use this range of solutions for my final experiment to find out the isotonic point of the potato:
0M, 0.2M, 0.4M, 0.6M, 0.8M, 1M
Experiment plan:
I am going to use six beakers of 50ml, the first one with distilled water the second with 0.2M solution, third 0.4M solution, forth 0.6M, fifth 0.8M and the sixth 1M. I am going to use two potato chips in each experiment so I can find a more reliable outcome variable by finding averages. I am going to mark one chip so I don’t mix them up and get the wrong percentage change in mass because the potato chips are going to be different in mass, so any mix up would ruin my results. I am going to measure the mass of each potato chip and record their masses in the relevant tables. I am going to make sure that these measurements are accurate by resetting the digital top-pan balance before each measurement is taken, I am also going to wait until the dial on the scales has stopped changing before I record the measurements. I am going to time the chips in their solutions from the minute my helpers and me place the chips in the designated solutions and then I am going to leave them for 15 minutes. I am going to have helpers because I want to make sure my results are as reliable as possible by keeping the chips in their solutions for exactly the same amount of time. I think 15 minutes is a sufficient amount of time for osmosis to noticeably take affect. When the time is up I am going to get my helpers to help me take all of the chips out of their solutions at the same time and put them on a paper towel to take off the extra solution that is on the chips, then I am going to measure the new masses of the chips and record them in the relevant tables.
Results of main experiment
I kept the temperature of the solutions at 17 degrees.
I made sure there was exactly 50 ml of solution in each beaker.
The mass varies between each chip because I am recording percentage change in mass.
The chips are 50mm in diameter.
I used this equation to work out the percentage change in mass:
Change in mass (g)
Original mass (g) = percentage change in mass
Conclusion
The graph tells me that as the molar of the solutions increase the mass of the potato chips after being left for 15 minutes in the solutions decrease.
There is a lot more difference in change in mass between 0.2 and 0.4 molar then there is between 0.6 and 0.8 molar and between 0 and 0.2 molar. The difference in percentage change in mass between two points that are next to each other gets less the further the molar of the solutions gets away from the Molar solution that is equal to the isotonic point of the potato. This is because if the pressure in the cell into which water is flowing is raised to the equivalent of the osmotic pressure, movement of water will stop (this is why the beginning of the curve is less steep) and vice versa when there is no pressure in the cell water molecules will stop flowing out of the cell therefore the mass will stay the same or start to reverse (this is why the end of the curve on the graph is less steep). This graph agrees with my prediction that as the Molar of the solution increases the percentage change in mass decreases. The reason why when the molar of the solution increases the percentage change in mass of the potato chip decreases is because as the Molar increases the amount of water molecules decreases and the amount of salt molecules increases in the solution and so there are more salt molecules blocking the cell membrane pores and less water molecules to go through them, whereas the solution in the potato cells stays constant and does not change. So the molar of the solutions the potato chips are in determines the effect of osmosis.
These results may be different if I used sugar in my solutions instead of salt, because sugar molecules are much larger. It would be a worthwhile experiment to investigate whether the molecular size affects the isotonic point.
Evaluation
My results look reliable because the points on the graph are all close to the curve of best fit and it all agrees with my prediction. It also gives a good curve. The quality of my results is good because I followed my plan and took every precaution I could think of and it proves my prediction was correct.
Some of my test results did not fit in with the others as some showed a too high or low percentage change in mass, for example chip 1 in the 1M solution in my final investigation got a much too high percentage change in mass. This may have been because they had been damaged when they where cut. When I worked out an average percentage change in mass using chips 1 and 2 in all experiments the results fitted in and became more reliable. The one anomaly in my final graph that did not quite fit in to my curve of best fit may of occurred because of a slight abnormality with the part of the potato I extracted the chip from or it may not have been dried with the paper towels enough.
At first I had problems creating the Molar solutions so that I had the same amount of liquid in each beaker, but I over came this problem by working out the amounts of each substance in each beaker of paper first so I could easily concocted the correct Molar solutions. Also I would have liked use more than two potato chips in each solution but I could not get enough chips out of one potato, I could have solved this problem by being more systematic about cutting the chips.
I think my results are reliable enough to come to a conclusion because all of the points are close or on my curve of best fit. The graph shows a pattern that I have explained in my conclusion. The graph shows that as the molar of the solutions increases steadily they percentage change in mass does not decrease steadily, the Molar of the solutions is not proportional to the percentage change in mass, but I think that this is meant to happen because the pressure inside the cells are getting closer to osmotic pressure so the water flow into the cell starts to slow down that is why the graph is less steep at the beginning of the curve and it is less steep at the end of the curve because it is getting closer to having no pressure in the cells so when there is no pressure in the cells no water can flow out the percentage in mass change will stay the same or start to reverse.
I could have improved my investigation by using four chips in each experiment instead of two because this would make my results twice as reliable as I would get a better average change in mass and there fore a better average percentage change in mass, and my results may of produced less anomalies. Also if I had the time in lessons I would have left them in their solutions for 20 minutes, as this would also make my results more reliable because I think 20 minutes gives osmosis I better time to occur and this may have prevented some of my anomalies in my results and make my results more reliable and accurate. If I was to use twice as many solutions (0.1M, 0.2M, 0.3M, 0.4M,--,1M) I would have twice as many points on my graph which would give me a lot more accurate isotonic point and therefore make my investigation more accurate.