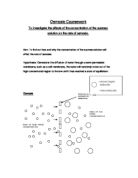
Osmosis is a special kind of diffusion involving the overall movement of water molecules from a region where they are at a higher concentration to an area where they are at a lower concentration through a partially permeable membrane.
In osmosis, a membrane that only lets solvent particles pass through separates two solutions. This means that the solvent particles continue to move along a concentration gradient but the solute cannot move freely because the particles are too big to pass through the membrane.
Partially permeable membranes are also found in living organisms such as the lining of eggshells. Osmosis is important because it helps us to explain many features of organisms. In animal cells it is important that as little water moves in or out of the cells as possible because if too much goes in then the cells swell and burst. If too much leaves then the cells shrivel up and stop functioning so in animals it is important to maintain the bodily fluids at the same concentration as the cell contents. All of the complex systems which exist in most animals such as the kidneys and adrenal glands that control the level of salts and sugars in the bodily fluids have evolved and are balanced due to osmosis and maintaining a constant body environment to prevent osmotic damage.
The solute concentration is greater inside the cell; the free water concentration is greater outside so, free water flows into the cell.
AIM
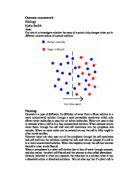
Our aim is to discover the effect of osmosis on 40 potato cylinders in different concentrations of sugar solutions.
HYPOTHESIS
I think that the potato cylinders in the solution with the highest percentage of sugar in will expand the most because osmosis will balance out the concentration of water in the solution.
APPARATUS
In the experiment we used:
- 40 test tubes
- 8 test tube racks
- 40 potato cylinders measuring 10 mm
- A ruler
- A knife
- Borers to cut potato cylinders
- 2 measuring cylinders (1 for water, 1 for sugar solution)
- 8 different sugar water concentrations
METHOD
We used 8 different concentrations of sugar solution in the experiment and each of the 100cm³ of 8 concentrations were put into 5 test tubes. We then cut 40 potato lengths each measuring 10 mm and put 1 potato cylinder in each of the 40 test tubes. We left the potato in the test tubes for 30 minutes then emptied the solutions and measured all of the cylinders. Then we measured the new lengths accurately with a ruler. We wrote down all of the results clearly.
For safety, we were very careful with all the glass wear. We were also careful with the sharp implements such as the knife by keeping fingers and thumbs away from the blade whilst cutting.
To make this a fair test we cut all of the potato cylinders the same length used the same amount of liquid in the test tubes, left the potato samples in the liquids for the same amount of time (30 minutes) so that osmosis had the same amount of time to take place in every variant of concentration and we also measured the cylinders accurately with the same ruler each time.
RESULTS – Explaining the table
(See results table)
The results are set out in order of strength of the solution, starting with 0% (water), which is the control solution so that we can see how the difference ranges when no sugar is present, to 10%, which is the strongest solution.
The ‘length before’ rows show the new length of the potato cylinders after osmosis has taken place.
We did the test on each solution using 5 potato cylinders each time to make the results more accurate. Then, I added an average column to each of the 8 solution results boxes to show the average length after osmosis.
In the average column, the value next to (1) indicates the ‘mode’ average of the ‘length after’ row of each solution. To get the mode average of these results you have to pick out the value that occurs most frequently in the data.
The value next to (2) shows the ‘median’ average of the ‘length after’ rows. To get this number, you have to add together all of the values then divide that total by however many numbers you added together.
The percentage of solution (i.e. 0.8%) means that 0.8% of the liquid we put the potato cylinders in was made up of sugar solution. To get 0.8%, the sugar to water ratio must always add up to however much liquid you are going to use (i.e. 100cm³)
RESULTS – Observations
Our results show that in our experiment, the theory of osmosis and diffusion did not work properly.
Starting with observing the control test tubes (0% - water) the cylinders shrank by 1mm in 3 of the potato samples. The average length for the length after column in this solution was 9.4mm. This is 0.6mm under the starting length.
Next, the 0.1% solution. 4 out of the 5 potato cylinders grew. The new sizes ranged from 11mm to 13mm. The average new length was 11.6mm so osmosis had taken place here.
The 0.4% sample had a new average length of 11.2mm so osmosis had also taken place here but the length should have been longer than the average of the 0.1% sugar water solution.
The average for 0.8% sugar solution was 10.8mm, which is 0.8mm shorter than the average length for 0.1% solution and 0.4mm shorter than 0.4% sugar water sample.
1% solution – the average for length after osmosis was 11.4mm. 13mm was the longest potato cylinder.
The average length after osmosis for the 2% solution was also 11.4 but the longest potato cylinder was 12mm.
The average results for length after in the column for 8% water solution are the most anomalous at 8.8mm. The longest cylinder was 10mm and the shortest was 7mm. This is a huge 4.6mm shorter than the longest average – 11.6mm for 0.1% sugar water solution.
The strongest solution, 10% sugar water solution had an average of 11.2mm. This should have been the longest average, as osmosis should have taken the biggest effect on this solution.
Almost none of these results follow the hypothesis I made – the increases in length were not even in order. The results did not show many consistencies relating to any facts about osmosis or diffusion. I think this is either because we didn’t measure the potato cylinders properly before the experiment, the sugar water solutions were not very accurate in the amount of sugar in the test tubes or we did not measure the cylinders accurately after the experiment.
The most likely explanation is human error in the measuring or the cylinder samples because we managed to control all of the solution variables and kept them constant and fair.
To avoid mistakes such as measuring the potato wrong we should have double-checked the lengths before and after osmosis had taken place.
This experiment was not successful because the aim was not fulfilled - the results did not back up or prove the facts that are known to me about osmosis and diffusion.
If I had more time I would have repeated the whole experiment again, measuring the potato cylinders and the percentage of sugar water solution more accurately.
BIBLIOGRAPHY
The sources I have used to gather information on the topics of osmosis and diffusion for the use of this investigation:
- Encarta Online Encyclopaedia
- Longman Coursework Guides
- Usborne illustrated dictionary of biology
- Human Anatomy and Physiology
- Biology For You
- Oxford dictionary (for definitions)