Once I was at this stage I added the potatoes into the solutions. After I had done this I set stopwatch to half an hour. Once this time had passed a carefully took out the potato slices using some forceps and carefully and accurately found the mass of each one, recording the results as I went along.
Below are my results:
Improvements
- 5 slices instead of 3, I did this because I will get a broader range of results from which I can make a more accurate conclusion, also anomalies will be more easily identified.
- I didn’t find the mass of my potatoes I measured them instead. I decided to find the mass of them as a measurement didn’t give me a very precise and accurate data for each of the potato slices
- I only did my experiment once; however I decided to conduct my experiment 2 times rather than one because my results will be more reliable as I have taken data from each experiment two times.
-
Use five solutions instead of 3- they will be 0M, 0.25M, 0.5M, 0.75M and 1.00M- M stands for Morality Strength. For example 1.00M would be more concentrated than 0.25M
Predictions
For the 0.0M
I predict that the potato mass will increase because it will gain more water by osmosis. This is because a potato has salt inside it whereas 0M pure water has a much bigger concentration of water. Osmosis will make some water particles from the 0M solution move to the potato as there is more water in pure water than in the potato. I think that after the experiment this piece of potato will become film, larger and the mass will increase.
For the 0.25M
I cannot be certain whether the mass of this potato will increase or decrease as I am not sure how much salt is in the potato, I predict that the change in mass will be a low amount, but I’m not sure whether it is increased or decreased. I think this because I think the potato has a similar concentration to the solution.
For the 0.50M
I predict that the potato will lose water and become flaccid because I think there will be less salt in the potato than the solution. This means that the water concentration of the potato is greater that the solution concentration of water. The mass decrease will be greater than the solution concentration of water. The mass decrease will be greater that the change in mass for the 0.25M solution.
For the 0.75M
I predict that results for this solution will be similar to those of the 0.50M, however the potato will have lost more water than the previous potato in the 0.50M solution. I also predict that this potato will become more flaccid than the potatoes in the last 3 solutions, furthermore I predict that this potato will have shrunk down I size compared to it’s original length.
For the 1.00M
I predict that this potato will have shrunk the most in size, have the lowest mass and be the most flaccid compared to potatoes in the previous experiments. I also predict that the average concentration of salt in a potato is between 0M and 0.5M, as a potato has a weaker concentration to a 1.00M solution. Therefore the potato needs to gain water by osmosis. Consequently it takes some of the 1.00M solution.
Equipment List
- 5 Boiling tubes
- Boiling tube rack
- 5 Different solutions (0.0M, 0.25M, 0.50M, 0.75M and 1.00M)
- 5 Labels
- Stop Watch
- Balance
- 5 Slices of potato (approx same length)
- Pipette
- Measuring Cylinder (30ml)
- Paper Towel
- Forceps
Method
This method is not too different to the one in my preliminary work, however some improvements have being made.
Cut up 5 pieces of potato of which were all of similar size, I then removed any excess moisture for the slices by using a paper towel. I then proceeded to find the mass of the potato slices using a balance rather that measure the length of each potato like in my preliminary work. I then recorded this information into my results table so I didn’t forget. Soon after I measured out 20ml using a 30ml measuring cylinder of each of the 5 different solutions
- 0.0M
- 0.25M
- 0.50M
- 0.75M
- 1.00M
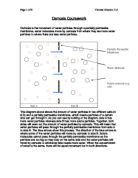
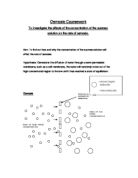
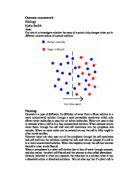
After this placed each one in a separate Boiling tube. I then stuck a label onto each boiling tubes that had the correct molecularly strength or pure water sign written on. After this a placed my boiling tubes into a boiling tube holder at this made it easier for me to conduct the experiment. I then laid out one piece of potato next to each separate boiling tube. At this stage my experiment looked like this:
Once I was at this stage I added the potatoes into the solutions. After I had done this I set stopwatch to half an hour. Once this time had passed a carefully took out the potato slices using some forceps and carefully and accurately found the mass of each one, I then worked out the percentage change in mass and recorded it into my results table,. I then repeated the whole experiment again and recorded my results which is displayed below:
Results Table 1- 1st experiment
Results Table 2- 2nd experiment
How I kept my experiment I fair test
- Ensuring all apparatus was clean and working properly
- Ensure all potatoes were submerged in the solutions at the same time
- Ensured that all my measurement was exact I did this by using a measuring cylinder and a pipette.
- Ensured the potatoes where in the solutions for no longer that 30 minutes
Conclusion
After conducting my experiment I have decided that it was a good idea to repeat my experiment twice as my results are now more reliable. I have discovered about osmosis and it’s effects on cells as my experiment proves, different strength solutions let in / let out water by osmosis. I have also found out that a potato contains a weak salt solution. I have found out that salt cannot be passed through a partially permeable membrane and that the water concentration could be moved around. My predictions were correct for the 0.25M the % change was negative so the concentration of salt solution in a potato must be around 0.1/ 0.2 M.
My improvements were successful in making my experiment fairer and my preliminary work was a success.
Evaluation
The two sets of results where different and don’t look similar on the graph, I must have gone wrong somewhere and this is why my results don’t tally. I think that the mistake was on the second experiment as on the graph there are many results spread out all over the place, whereas on the 1st experiment graph we can see a nice curved line that indicates good results.