Fair test:
To create a fair test certain aspects of the experiment will have to be kept the same whilst one key variable is changed. I have to choose a vary concentrations of the sugar solution. This will give me a vary varied set of results from which it will make a descent conclusion. If any of the non-variables below are not kept constant it would mean it would not be a fair test.
The non-variables are:
Surface area, Solution volume, duration of experiment, Temperature, Solution, Lengths, conditions).
Prediction:
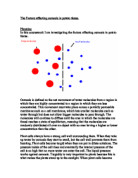
I think that the lower the concentration of the sugar solution in the test tube the longer the potato will be. This is because the water molecules pass from a high concentration, i.e. in the water, to a low concentration, i.e. in the potato chip; therefore the chips in higher water concentrations will have a taller chip than in higher sugar concentrations.
I used this method because this method will give me a vary varied set of results which will make a descent conclusion, a more accurate graph and which will then prove that my variables and non-variables were considered in the right way within the experiment, and will also prove that my results were accurate .
Table of results:
This graph above shows a clear indication that there was an overall decrease in length during the experiment. At the point 0.00 M the line for after the experiment is above the line for before the experiment unlike any of the others. This is because the water potential of the sugar solution is higher than that of the potato chip.
Conclusion:
The graph of my varied set of results is a smooth curved line where the highest point that represent the largest potato chip in length is the 0 moles of the solution while the last point is on the 0.5 moles, in conclusion the tube with the highest amount of the molar has the lowest average change in length and the lower the molar solution is the higher the average change in length goes up.
Analysis:
This shows that the potato cells increase in length in solutions with a high water concentration and decrease in length in solutions with a low water concentration. When the concentration reaches above 0.37 M. From the graph an estimate to the concentration of the potato cell can be made as 0.12 M, as this is the point where the potato is not increasing or decreasing in length, this is known as the isotonic point. This is where no osmosis is taking place; both the potato and the solution have an identical molar concentration. The next point, 0.25 M looses approximately 4.0 %. This shows that the water potential of the salt solution in the beaker is weaker than that of the potato chip. The next, 0.50 M, looses approximately 8.0 % in length. This shows that the salt solution has an even weaker water potential than 0.25 M and that osmosis took place. This is why the potato lost even more length, and it shows that the water potential in the beaker is less than that of the potato chip. This pattern carries on through the graph, and even more length is lost, as more water moves out of the potato into the solution. My results also match with my initial predictions.
Evaluation:
The experiment was very successful in my opinion. I obtained a large quantity of very accurate results from which I was able to create informative graphs. I think I took easily enough results for the amount of concentrations that I was using, and the time that I used for the experiment to last was enough to allow sufficient osmosis to occur. However if I was to repeat the experiment I might well increase the time of the result to allow more osmosis to happen and possibly find out the saturation point of the chips. The range of concentrations was adequate but I would possibly create more concentrations if I repeated the experiment so that I would have more varied results.
The cutting of the potatoes was the most difficult part of the experiment as although I was recording my results by length, it could well have affected the surface area and so the overall rate of osmosis. If I were to repeat the experiment I would have possibly found a machine to cut the potato as it would ensure that all potatoes would be the same length. As well as the potato I could have found a more accurate way to measure out the solutions and to determine the molar concentrations.
There were not any out of the ordinary results, but some were not as close to the line as others. This may have been caused by human. When the potato chips were removed from the test tubes and dried I may well have dried some potatoes more thoroughly than others and so some would have more excess water, which would add to the length. If the experiment was repeated I could find another way to dry the potatoes that would ensure that all were dried in the same way for the same time. However with all this said I think that the experiment was truly successful and I was very pleased with the complete comparison of my results with my initial prediction.