From this experiment, I found that the only variable in the experiment is the mass of the potato chips. This affected my final decision on my methodology as whether I should measure the lengths of the chips, to measure the mass only or measure both the mass and the length of the potato chips. The reason for that is there must be some change in the mass of the potato chips instead of the length. Since there was no change in the length of the chips, then it will not prove the theory of osmosis to be correct.
Apparatus:
-
potato x 1
-
potato borer x1
-
water and concentrated sucrose solution(1 molar) 1 bottle each
-
stop watches x6
-
boiling tube/test tube x 6 (at least)
-
test tube/boiling tube rack x 1
-
measuring cylinder x 2
-
ruler x 1
Prediction:
The average sucrose concentration of a potato is 0.5M. So I think that the potato chip with the most movement will be the ones in the 1M and 0M and so the masses of the potato chip in the 1M solution will decrease and the potato chip in distilled water (0M) will increase. Apart from that, I think that the mass of the potato will remain stable in concentration of around 0.5M. Even if there are increases in the mass of the potato chips, I think there will be hardly any changes with the lengths of the potato chips would not be very different to the lengths of the potato chip before the experiment. When I draw the graph of my results after the experiment, I think that there will be a strong correlation where the osmotic movement of water in and out of the potato chip is roughly directionally proportional to the sucrose concentrations. Finally, I think that there will be a point where the cell membrane changes from semi-permeable to impermeable. For the cell membrane to become impermeable from semi-permeable, it must mean that the sucrose concentration in and out of the cell are the same.
Hypothesis: First of all, osmosis is the movement of water from a dilute solution to a more concentrated solution through a partially permeable cell membrane. Plant cells have a great deal of water surrounding them. Their cell wall stops the cell from bursting or as they start to swell when they take in too much water by osmosis. What happens is that they become turgid from being in a dilute solution as the pressure inside the cell increases or become plasmolyzed in a concentrated solution as the pressure inside the cell decreases because of having being in a more concentrated solution. The cell wall will do the opposite if the cell has been plasmolyzed because it has been in a stronger sugar strength even though the cell membrane will shrink because if the lack of water.
When osmosis happen in an animal cell in a dilute solution, the cell membrane bursts as the water keeps moving into the cell from the high concentrated solution into the cell. This is because animal cells have no cell wall to keep their shape (or in another words, to control the amount of things going in and out of the cell by balancing out the pressure inside the cell). When plant cells are in the same situation, this does not happen. This is because an animal cell does not have the cell wall like what plant cell does as it keep the shape of the cell. The reason why they do not burst in the situation is because the pressure applied by the cell wall is opposing to the pressure inside the cell and so they will eventually be equaled to the water concentration outside as the cell wall stop solutes form entering the cell. When a plant cell is placed in a solution with a lower water concentration, the cell becomes flaccid and so the cell membrane leaves the cell wall. This is because there is a lack of osmotic pressure against the cell wall. This still will not affect the size of the potato chip because it is the cell wall keeps the cell’s shape, not the cell membrane. Equally in the case of a plant cell in a dilute solution, the osmotic movement will eventually stop as the cell membrane becomes impermeable. Osmosis can only happen in cells that have semi-permeable membrane. But why will its cell membrane eventually become impermeable? This is also because of the cell wall’s controlling the shape of the cell. When the water concentration of the cell’s internal increases to a point where it’s the same as the solution surrounding it, the cell wall need to make sure that the shape and size of the cells do not go exceedingly too much. So therefore, the cell membrane must stop its permeability.
Variables:
In this experiment, the things that could affect the result are:
- The concentration of the sucrose solution
- The size of the potato chips (diameter and length of the chip)
- The quantity of the sucrose solution
- The quantity of the potato chip
- The amount of time the chip has been in the solution
Experimental variable:
In order to provide a fair test, I have decided to use different concentrations of sucrose solution as the experimental variable.
Fair test:
- To ensure that the experiment is a fair test, I would make sure that the potato chips all have the same volume (diameter, length and similar masses). To do that, I could use the same potato borer, knife and ruler to make the six potato chips.
- To make sure that all the potatoes have the same rate of osmotic movement, I would make all the potato chips for each set of results from one single potato so that there would be an accurate set of result.
- To make sure that the sucrose concentration to distilled water are the same, I first measured the amounts of sucrose solution and distilled water needed for the solution needed before mixing them together.
- Apart from those, I think I will need to make sure that the amount of sucrose solution in each of the test tubes are the same before I put the potato chips in the solution.
- Since I could place all the potato chips into the solutions and start timing all at the same time, I need to put time them separately.
Method:
- I make the potato chips with a potato borer and measured their lengths, their mass and record the information.
- Make the solutions, (Note: make sure that they are all at the right strength) pour them in a test tube, leave it in a test tube rack and label each of them.
- Place the potato into the ready mixed sucrose solution and start timing using a stop watch and wait for 40 minutes.
- After 40 minutes, take the chips out and dry it with a paper towel. With the same scale, measure the mass of the potato chip and note it down. Then I would measure their lengths with the same ruler I used at the beginning of the experiment to see if there is any increase in the size of the potatoes during the experiment.
Safety:
This experiment is potentially not dangerous. The following are the things I think might go wrong during and after the experiment:
- Getting confused with which potato chip has been in which solution; therefore, I will end up with a mixed up set of results.
To solve the problem, I will need to label each of the test tubes first with the solution’s sugar strength. Then, I will need to weigh the masses of the chips and write down their mass neatly in a table. Then, I will need to put each of them in the solutions separately and in order. After that, I will need to start timing with a stop watch at the moment when the potato chip is placed in the solution. At the end of the experiment, I need to take the chips out, weigh their mass and record their new masses on the table I drew up. Then, I need to work out things like: their differences in mass before the experiment
- Getting the wrong proportion of sucrose and distilled water while mixing the sucrose solution.
If I mix the two different solutions together straight into the same measuring cylinder, then consequently the proportionality of the two solvents for the specific strength would be like to be wrong. To solve this, I will probably need two or more measuring cylinder so that I can measure the sucrose and water as they each have different densities. I will need to get the correct amount of each solute (distilled water and sucrose solution) and pour them into a beaker. After this, I will then pour a reasonable amount of the solution into the boiling tube which will then be used during the experiment.
Measurement:
- The mass of the potato chips in grams using a balance. Once before the experiment and once after the experiment.
- The lengths of each of the potato chips in centimeters to ensure that their masses are the closest possible with a ruler. Because of its purpose, I will only need to measure it before I weigh each chip.
- The concentration of the solution using measuring cylinders to measure the amount of sucrose and distilled water in milliliters before mixing them together.
- Length of time the chip has been in the solution by using a stopwatch in minutes all through the experiment.
- I will also measure the length of the potato chips before and after the experiment to compare if there is changes in the lengths of the potato chips
Analyising Evidence and drawing conclusions:
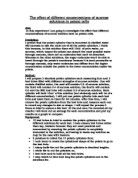
The graph of my results:
*Note: On the graph above, if the point is below zero, then the mass of the potato chip has decreased. And if the point is above zero, then the mass of potato chip has increased.
Conclusion:
As I have said in the prediction, “…. the potato chip with the most movement will be the ones in the 1M and 0M”. And after the experiment, I have realized that the prediction I made before the experiment was right. As you can see for the graph of results from above, you can see that the potato chip that had increased the most mass after the experiment is the one in the 0M solution and the potato chip that had decreased in mass the most is the one in the 1M solution. In another words, the two potato chips that had the most changes is the ones that has been in the distilled water and the 1M solution. This proved that these potatoes’ sucrose concentrations are not extreme and the average isotonic point would not be strange.
I think that the results I got in this experiment is not as satisfying as I thought it would be before I did the actual experiment as there is an unexpected rise in the graph for the potato chip in the 0.8 M solution. Other than that, I think that my results were quite reliable and accurate because drawing the line of best fit was quite easy because the other points were almost following a straight line and a strong negative correlation. The strong negative correlation shows that the more concentrated the solution is, more water moves out of the potato chip by osmosis in order to balance out the sucrose concentration in and out of the cell. From the line of best fit, the average of the isotonic point of the potatoes is about 3.33 M.
Apart from the changes in mass, I also tried to find out if there is any changes to the lengths of the potato chips. As you can see from my results, I could see that there was hardly any changes to the lengths of the potato chips. Overall, I could on see from my results that on average, there was little or no change to the lengths of the potato chips. Other than that, I noticed that despite the small changes to the sizes of the potato chips, the lengths of the potato chips either staied the same or increased by 1 or 0.5 millimeter. I think what this might show that the cell wall might only be able to let the cell increase instead of letting it shrink in its size.
This furthurly prooves my prediction. “Even if there are increases in the mass of the potato chips, I think there will be hardly any changes with the lengths of the potato chips would not be very different to the lengths of the potato chip before the experiment.”. There was little change in the lengths because like I have said in the hypothesis, the cell wall surrounds the cell in order to keep the shape and so to stop the cell from bursting when there is too much water in the cell.
The mass changes of the potato chips that I have recorded have an anonymous result. It was the potato in the 0.8M solution. The mass change was supposed to be more, causing the rise in the graph. I think that the only thing that might have caused this unexpected error might have been made because there might be a mistake I have not noticed when I did my experiment.
Evaluating Evidence:
Evaluation of Method:
I think that the method I used is quite reliable because the results I got did actually prove that there is water movement happening when potatos are left in sugar solutions of various concentrations. Also, most of the results prooved that “water move from a higher concentration to a lower concentration through a semi-permiable membrane.” But on the other hand, one of the results I had was strange because theortically, the change of the weight of the potato chips should follow a trend of increasing in mass if the sucorse concentration is less than the one of the potato chip and a decrease in mass if the sucrose concentration is higher. So in another words, the line on my graph should follow negative corrolation going downwards. But, the average mass change that I worked out for the potato chip in the 0.8M solution was higher than it should.
From my results, I could on the other hand evaluate that my method is quite fair. Otherwise, each mass change would be following a difference trend pattern and so therefore it will be impossible to actually draw a line of best fit. Also, the difference in the lengths of the potato chips had nearly no change. This also shows that my method and experiemt was planned out quite fairly because otherwise the lengths changes would not be little like only increasing o.5 mm or 1mm in the lengths in my experiment.
If I was to do this experiment again, what I would change in the methodology is to be more careful when measuring the readings. This is because when I did the experiments, I thought that I was not going to finish the expeiment on time. So at the beginning of the experiment when I was measuring the amount of sucrose solution and distilled water, making the potato chips and making sure that they’re the same length, I rushed through them. I think that’s probably why I got an unexpected result for the potato chip in the 0.8M solution. Even though there was not a mistake for every single other little experiment, but there might have been some slight mistakes.
Evaluation of Results:
I think that the results I got was quite reliable and accurate despit there was something that has gone wrong with the potato chip in the 0.8M solution. From the graph of my results, I could see that it was an anonymous result. Overall, I think that the result are quite accurate because even though there was only one result that is out of the pattern from the rest. This does not matter very much because despite there may be a certain mistake for the osmotic movement in the 0.8M solution, but the other results are all very similar. The similiarities between them would still provide evidence for the theory of osmosis to be true even without the result for the 0.8M solution. Also, we could still predict the result for it using the line of best fit in the graph.
Bibliography: