Definition:
(Taken from “The Hutchinson Encyclopedia”)
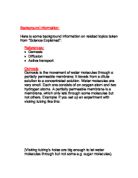
Osmosis: Apparatus for measuring osmotic pressure. In 1877 German physicist Wilhelm Pfeffer used this apparatus to make the first ever measurement of osmotic pressure and show that osmotic pressure varies according to temperature and strength of the solute (dissolved substance)
Equipment:
- Boiling tubes
- Rubber bungs equal to the amount of boiling tubes
- Salt solution
- Potatoes
- Scalpel
- Water
- Cork borer
- Top pan balance (scales)
- Tweezers
- Paper towels
- White tile
Method:
-
1. Set up equipment as shown below:
-
2. Cut six potato cylinders out of the same type of potatoes.
-
3. Cut them down to 4cm each.
-
4. Dry the wet cylindrical face of the bored potato using a paper towel.
-
5. Find the weight of each cylinder to the nearest 0.01grams using the top pan balance.
-
6. Measure each cylinder and record weight and length in a table, leaving space for weight and length after the 3-day period.
-
7. Place the six pieces in six boiling tubes containing different concentrations of salt / water (all concentrations add up to 10ml:
1: 10ml water
2: 2ml salt solution + 8ml water
3: 4ml salt solution + 6ml water
4: 6ml salt solution + 4ml water
5: 8ml salt solution + 2ml water
6: 10ml salt solution
-
8. Place a rubber bung in each one and leave for 5 hours.
-
9. Remove bungs and cylinders.
-
10. Dry each cylinder with a paper towel and weigh each potato piece again.
-
11. Record results.
-
12. Repeat this once more and then find the average result.
-
13. Work out the change in mass (%) using:
Change (%) = difference
Initial x 100
Safety:
- Wear goggles at all times.
- Don’t put any equipment near to or on the edge of a bench.
- Be careful when using cork borer, push through on to white tile not your HAND so you don’t cut yourself.
- Use a test tube rack to hold the boiling tubes.
- Be careful with the scalpel and cut away from yourself.
Variables:
- I will change the concentration of water and salt solution in each.
Accuracy:
I will keep the test accurate by solving the factors involved.
I will conduct both tests at the same time, which means the temperature (room temp) and light intensity will be the same. All the potatoes will be treated the same way e.g. same type of potato, same size of potato. This will keep the water levels in the potato cylinders equal from the start, and not allow this to change until the test has begun. I will measure the volume of solution the potato with a cylinder accurate to 0.01ml, which ensures the most accuracy in that. The same size potato borer will be used to ensure that the surface area of the potato is equal. The same size boiling tube and potato cylinders will be used throughout the test. To make the mass readings more fair, I will take each cylinder out of the solution, roll all the surfaces gently on a paper towel, (2 seconds on each surface), to remove all excess solution, and I must not squeeze the chip. The same top pan balance will also be used throughout.
Measurements:
All my results and tests will be written in the same measurements:
Grams (g) – This measurement is a weight
Millilitres (ml) – This measurement is a volume of liquid
Millimetres (mm) – This measurement is a length
My Prediction:
I hypothesize that the higher the concentration of salt solution the more water will move out of the potato cylinder. We know that osmosis is the flow of one solvent (water) of a solution through a membrane while the other constituents are blocked and unable to pass through the membrane. Experimentation is necessary to determine which membranes permit selective flow or osmosis, because not all membranes act in this way. Many membranes allow all or none of the constituents of a solution to pass through (permeable or non-permeable membranes); only a few allow a selective flow. As the potato is a plant cell, it contains a vacuole and a cytoplasm. The cell membrane is also partially permeable i.e. it lets some substances in but not all substances. This means that water diffuses into cells by osmosis, if the cells are surrounded by a weak solution. (Osmosis is the movement of water molecules from a high area of water potential to an area of low water potential through a selectively permeable membrane.) If the cells are surrounded by a stronger solution, e.g. salt water, the cells may loose water by osmosis.
Prediction graph:
I have drawn a graph based on what I think will happen due to pre-tests and background information knowledge taken from “science explained” written by Colin. A. Roland.
Results:
(The temperature was 20 degrees centigrade)
Graph based on results from tests A and B:
I think that Test B showed a lot more better and accurate results compared to test A; it had 2 fairly anomalous results and did not really show what I hoped, Test B however did. I am not sure why Test B was more accurate than Test A because they were treated the same way at the same time. I think that the two anomalous results in test A may have been due to something in the potato, or perhaps they were taken from the centre of the potato and this may have differently shaped cells to the outer part of a potato. I am not entirely sure what happened though, but I think it is fair to blame these results on something in that part of the potato.
Average results:
Average = Before A + Before B
2
(Temperature is 20 degrees centigrade)
Graph based on average results:
Analysis:
My graph is a curve that slopes downwards and does not go through the origin. Because the line is not straight and does not pass through the origin, it means that the percentage gain/loss in mass and concentration are not directly proportional. However, there is a pattern on my graph, and this is, as the concentration of the salt solution increases, the percentage change in mass decreases. The gradient does change in my graph. It gets less steep as 'x' gets bigger. This is because the potato cylinder is becoming as flaccid as it possibly can, and so the change in mass of each concentration are becoming closer and closer together. All of my results lie close to my best-fit curve. This shows that my results are fairly reliable. My graph fits in with my prediction of the experiment graph.
The average water gains in mass. This means that osmosis takes place and that the water moves from the beaker into the potato. This matches my initial predictions, and fits in with my prediction graph as well. The point where the line crosses the x-axis is the isotonic point. This is where no osmosis is taking place, i.e. no water is moving in or out of the potato. The next point, 0.2 molar looses approximately 0.2g. This shows that the water potential of the salt solution in the beaker is weaker than that of the potato chip. The next, 0.40 molar, looses approximately 0.5g in mass. This shows that the salt solution has even weaker water potential than 0.2 molar and that osmosis took place. This is why the potato lost even more mass, and it shows that the water potential in the beaker is less than that of the potato cylinder. The potato is trying to make the water potential of the fluid on both sides of the semi permeable membrane the same, (osmosis from the potato to the salt solution, from a higher water potential to a lower one). This pattern carries on through the graph, and even more mass is lost, as more water moves out of the potato. My results fit in with my initial predictions. These were that osmosis would take place, and as the concentration increases, the percentage change in potato mass will decrease.
Evaluation:
The experiment was easy to do, but all the results I had to take had to be accurate had to change my plan several times. Things like having the potato chip 5cm long changed to 4cm because it was hard to have all the chips 5cm long because, and 4cm was sufficient. Also, I changed the amount of solution I would keep the potato chips in, because I only needed enough to cover the potato chip. These changes were easy to make, because I did a pre-test, so I could iron out any errors that may have occurred in my actual experiment.
I think I took enough results for the amount of concentrations that I was given. The range was big enough, but to fill in the gaps in my graph, I could have taken results of more moralities, i.e. 0.10molar, 1.3molar, 1.5molar, etc. This way I could have found the isotonic point by there being no change in mass. Also to make my experiment better I could have repeated it more or been slightly less lenient with times restrictions because while I was getting test A weighed up test B will have had a little longer in the solution, maybe causing the potatoes mass to change, varying and altering my true results. I could have also used cloned potatoes, so that they would have all been the same. I could have also cut the potatoes into doughnut shapes, because the cells in the centre of the potato may have a different capacity of water and the intake, or distribution of it. If I had cut the potato into doughnuts, I would have only been using the out side of the potato, leaving out the middle. I could have also used a machine to cut the potato chips.
My results did lie close to the curve, and therefore were fairly accurate, but if I was doing the experiment again I could make changes, some as mentioned above. I could also use a more accurate measure to measure out my solutions. This would ensure that I have an accurate amount of fluid in each test tube. I could also weigh each chip on a digital and more accurate scale, e.g. not to 0.00 but to 0.0000g.
There was one main anomalous result. This may have been caused by human error, or one out of my six results could have been inaccurate, and changed the average drastically. Or perhaps the potato chip was not cut accurately, or that part of the potatoes, cells did not loose/gain mass well. My results did vary a lot for the same concentration. The fact that a certain part of the potato may not be the same as another was shown as the chips all of the same length were not the same weight, or even close. This is another reason to use cloned potatoes. My results were consistent, and there were no results that were ignored.
I could extend my enquiry by testing the percentage change in mass with morality using a different substance. By this I mean using a different vegetable, perhaps celery or cucumber. Then I could find out whether osmosis occurs with the same patterns and trends with any vegetable.