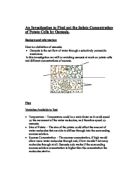
0.0, 0.1 molar solutions (Not much water)
0.2, 0.3, 0.4 solutions
High Concentration Low Concentration
Solute Molecule
Water Molecule
Net movement
Therefore, I predict that during this investigation, as the concentrations of salt gets higher, (0.2m, 0.3m, 0.4m) the more the chip will lose mass and at the lower concentrations the chip will gain mass (0.0, 0.1).
Variables
The input variable for this experiment is the concentration of salt solution.
Control Variables:
I will keep the mass and size the same to as accurate as possible, although if I cut chips to the same size, the mass may be different as there may be a difference in concentration of water in different chips. This is because more water particles will cross the semi permeable membrane if there is a larger surface area, or if there is more molecules in the chips. The control variables are temperature as temperature effects particle movements as the temperature gets higher, the particles will move faster. Therefore, the amount of particle movement across the semi-permeable membrane will increase (or vice-versa). The size of the chip as it effects the amount of osmosis that takes place as when the chip is larger it will have a larger surface area and therefore particles can escape more easily (or vice-versa). The soaking solution volume, which I will keep at 25ml. I will use the same potato as a different one may have a different volume of water in it. I will leave the chips for about 2 hours as this gives enough time for osmosis to take place. I will use the same balance as a different one may give different weights. I will mix the solutions thoroughly so the salt doesn’t stay in the same place in the test tubes. The total volume will be at 30ml to keep a fair test.
Dependent variable:
The dependent variable will be mass. I will measure the mass using a scale accurate to 0.01g so I will be able to get accurate results.
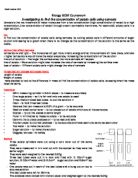
I will use five different concentrations, 0.0%, 0.1%, 0.2% and 0.4%. I will do this to try and find a pattern in how much osmosis has taken place. I have made a table to show what measurements of each substance I will need.
What equipment will I need?
- 5 large test tubes to perform experiments in
- A 30ml measuring cylinder
- Sharp knife
- Tile
- 0.01g digital balance
- Clock
How am I going to ensure my results are accurate (fair test)?
- Repeat the experiments three times
- Make sure the same person cuts the chips, as someone else might cut the chips differently
- Make sure the same person measures out the liquids as someone else may measure them differently
- Keep the temperature constant by putting the boiling tubes in the same place
- Take out any anomalous results and repeat the experiment
- Label the beakers so the liquids aren’t mixed up
Method
First I will measure out the solutions and put them in the test tube and mix the solutions so the salt is spread out and not just in one place. I will then cut the chips as accurately to the same size as possible, then weigh them and put similar weights in the same test tube. Then, I will use a marker pen to number the chips to make sure they don’t get mixed up. I will then put the chips in the test tubes at the same time and leave them for at least two hours to let osmosis take place. I will then remove the chips and pat them on a towel to remove any water on the outside of the chip and weigh them. I will record my results in a table.
My results table
- The results I have got are very good, as I cut the chips to accurate weights.
- I believe I have enough to draw a graph which will represent the trends in my results
- My results are good because I stuck to my plan, which ensured I prevented any possible problems before they occurred as they were already thought through.
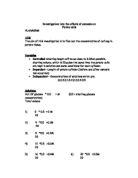
Graph showing average time for each concentration
- My graph has no anomalous points, which shows that my technique was good.
- The graph is a curve because as the concentration decreases, the weight of the chip decreases.
- When you get to the lowest concentrations (0.0%), the weight difference at the end is more significant than at higher concentrations. Therefore a curve is created.
Analysis
During the investigation, some chips gained mass whilst some lost mass. Some chips lost water whilst some gained water. When I soaked chips in 0.0 and 0.1 molar solutions, the chips gained mass and when I soaked them in 0.2, 0.3 and 0.4 molar solutions the chips lost mass. This means that osmosis has occurred, as water has travelled across the semi-permeable membrane, with a net movement of particles travelling down the concentration gradient.
My results are not linear, as the graph is a curve. This is because at low concentrations, a small increase in concentration causes a large drop in mass whereas at higher concentrations an increase in concentration has a lesser effect on the mass change.
When osmosis happens cells become turgid if water flows into them and plasmolysed if water flows out. This is because plant cells have cell walls, and when water enters the cell, the wall is stretched out and when it is too turgid it squeezes the water out of the cell. During this investigation I noticed no difference in the look of the 0.1 and 0.2 chips but in the higher concentrations, the chips went flaccid, as a lot of water had left the chip.
The results show, as predicted in my hypothesis that water particles travel down a concentration gradient. When the concentration of solute is higher on the outside than the inside of the chip, water particles will enter the chip and vice-versa. According to my results, at 0.125 there is no concentration gradient and therefore there is no net movement of water particles, although particles still cross the semi-permeable membrane. This is known as a dynamic equilibrium.
Evaluation
In my opinion, the experiment worked well as I gained a good set of results. My graph represented my results clearly.
I had no anomalous results during my investigation. This is because I worked to my plan, which explained clearly what techniques to use. This is mainly due to my thorough plan and lessons I learned from my preliminary investigation. My plan ensured that that any mistakes that were possible were prevented before they happened. E.g. labelling the test tubes so they don’t get mixed up and using a sharp knife to cut the chips. The only problem I had was that the marker pens used to label the chips did not work very well; this was rectified by using a different pen.
Improvements I would make to my experiment is to make a template to use to see if the chips were cut to the right size, this is because when I cut the chips I had to see if they were the right size by eye and this process could have caused an inaccuracy.
Changes
-
I could use a cucumber instead of potato as cucumber is approximately 98% water which could affect the amount of osmosis. (A potato is 0.36M water)
- I could use different varieties of potatoes and see what effect this has on my results. E.g. red skin, yellow flesh, early market, chipping, Goldrush and see if this has an effect on the osmosis.
- I could use seaweed, as they live in a salty habitat (the sea is around 2.6% salts). This means the cells have a higher concentration of salt and maybe this can have an effect on the mass change.
- I could use different concentrations over a smaller range as this would improve accuracy and improve the graph. I could use the following concentrations: 0.05m, 0.1m, 0.15m, 0.2m, 0.25m, 0.3m, 0.35m, 0.4m, 0.45m. These would be made by mixing: