- Temperature
- Volume of sugar solution
- Concentration
- Weight of potato
-
Surface area
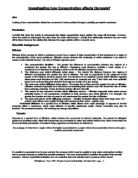
To create a fair test certain characteristic of the experiment will have to be kept the same whilst one key variable is altered (surface area, concentration of solution, temperature are all key variables as these are the ones that effect the amount of osmosis that will occur). It has been chosen to vary the concentration of the sucrose solution: the concentration will be measured in molars: this will then become the independent variable.
To make sure this is a fair test I will have to keep all the variables constant apart from the concentration. If I did change one of these variables, say surface area: if one potato chip were 1 cm longer than the other there would be more surface area for osmoses to occur, therefore the test would not be fair. If I altered the temperature osmosis would also be effected: the warmer most atoms are the more quickly they move, therefore,
increased temperature will increase the rate of osmosis. The starting weight (mass) of the potato chips is something that is going to be difficult to get exact as even though they will be cut with the same Borer and cut to the same length, there will be a slight variation in density of the potato or some other unavoidable anomaly may make the potato chips weight slightly different amounts. Even though mass is a variable that cannot be ignored, for the purpose of this experiment it is not crucial as I will be measuring the alteration in mass in percentage and not comparing mass directly. The volume of sugar solution in whatever concentration has been standardised to 10 cm3: if it was more it would not matter but if it were to be less then It might not cover the chip completely and therefore osmosis would be hindered as there would be less of a surface area as some of the chip would not be in the solution.
To make sure the experiment remains fair I will do all my experiments at room temperature (approximately 20°C (any other temperature would be difficult to maintain and may effect results), use the same type of potato, which will be kept at the same size (length and width)) and weight and have been treated in the same way. I will also use the same volume of the solution in the test tube is kept fair. I will use an accurate electronic balance in this experiment, to make certain even small changes in mass are recorded. I will also keep using the same balance (if possible) throughout the experiment so the measurements do not vary due to any change that may be introduced by different scales.
Range of Values:
We are going to be given enough sucrose solution to do five different concentrations (repeating each three times and taking an average to improve accuracy) and one of just distilled water: but as we will aim to find the solution that has the same concentration of water molecules as potato tissue, our experiment will have to be done in two stages. In the first stage we will us the concentrations:
0.0 molar (distilled water)
0.2 molar
0.4 molar
0.6 molar
These concentrations were chosen because in our preliminary results we found that 0.8 molar was going to be to high (too far off (the percentage was a large decrease) the aim of finding the exact concentration of water molecules inside the potato) and that 0.0 molar was too low (the percentage increase was not too far off 0 % change but logically water would be a little way off the aim of 0 %): we decided to go up in 0.2 of a molar because that way we could cover a wider range with our limited resources: we are still going to do 0.0 molar as a sort of control (it also does not use up any of our allowance of sucrose) The concentration that has the closes to 0 % alteration in length and mass will be the basis for stage two of the experiment. Whatever this concentration may be, we will try the concentrations either side of it to attempt to determine the solution that has the same concentration of water molecules as potato tissue and no osmosis will occur. How far either side will be determined when stage one has been carried out and the results analysed.
Prediction
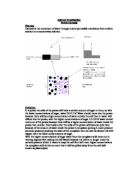
Osmosis is defined as ‘the movement of water molecules from an area of high water concentration to an area of low water concentration, across a semi-permeable membrane’ (Collins, 1999). In a low concentration of water the amount of solute (e.g. sugar) is high. This could be called a strong or concentrated solution. When two such solutions are divided by a semi-permeable membrane the water will move from the area of high concentration to the area of low concentration, until both sides are equal (have reached equilibrium).
This can be seen in living cells. The cell membrane in cells is semi-permeable and the vacuole contains a sugar solution. So when a cell is placed in distilled water (high water concentration) water will move across the semi-permeable membrane into the cell (lower water concentration) by osmosis, making the cell swell. This cell is now referred to as turgid. If done with potato cells the cells would increase in length volume and mass because of the extra water.
If these potato cells were placed in a solution with a low water concentration, then the opposite would happen. Water would move out of the cell into the solution. In extreme cases the cell membrane breaks away from the cell wall and the cell is referred to as plasmolysed. The potato cells will have decreased in length, volume and mass.
The greater the concentration of water in the external solution the greater the amount of water that enters the cell by osmosis. The smaller the concentration of water in the external solution the greater the amount of water that leaves the cell.
However, there will be a point where the concentrations of water inside and outside the potato cells are equal (isotonic). At this point there will be no change in the length, volume and mass of the potato, as the net movement of water will be zero, no osmosis has occurred.
I predict that the higher the sugar concentration, the more water will transfer from the potato into the sucrose solution making the potato decrease in mass and length, and vice versa for a lower sugar concentrations. I believe this will happen because the solution is diluted with water; the water molecules will transfer over to the stronger solution: whether this is the solution or the potato. Thus occurring osmosis.
I also predict that if a sample floats in the solution then it will gain weight and osmosise and if it sinks then the potato will ex-osmosise.
Results Table
Alterations to Planned Method
In my planned method I indicated that I would attempt to do my experiment in two stages in order to get as closes as possible to the aim of determining the concentration of water molecules inside a potato chip. This was not actually feasible therefore we altered the planned concentrations to the following six:
0.0 molar (distilled water)
0.2 molar
0.3 molar
0.4 molar
0.5 molar
0.6 molar
This allowed us to carry out the entire experiment in one go rather than in two stages. This may have proven to make the final results less accurate but it was more important to keep to the minimum amount of time.
It was also unpractical as well as difficult to measure the length of the potato chips as well as the weight therefore this was not done. I do not believe that it will have effected the conclusions in any way.
Analysis of the graph and Conclusions
I believe the line of best fit for the point on the graph to be a straight line; this shows that mass percentage loss and gain are proportional to the concentration of sugar solution due to the fact that the variable of concentration is not limited by other factors, unlike the variable of temperature where too high or too low a temperature might alter the potato in some way that was not desired for the experiment. Therefore the graph shows that as the concentration of sugar solution increases, the percentage change in mass decreases going from a 15 percent increase when the potato chip was in distilled water only, to a 26 percent decrease when the potato chip was in a solution of 0.6 moles of sugar solution. This gives the graph a definite negative correlation. This relationship is due to the water molecules will transfer over to the stronger solution (moving down the concentration gradient): whether this is the solution or the potato. This is because the cell membrane in cells is semi-permeable and the vacuole contains a sugar solution. So when a cell is placed in distilled water (high water concentration) water will move across the semi-permeable membrane into the cell (lower water concentration) by osmosis, making the cell swell. When the potato chips were placed in a solution with a low water concentration (high sugar concentration), then the opposite would happen. Water would move out of the cell into the solution. The selectively permeable membrane of the potato cells allows water to move between the solution and the cells but not the sugar, as the sugar molecules are too large to ‘fit’ through the membrane.
Where my line of best fit crosses the x-axis, I believe to be the amount at which the concentration of water molecules inside and outside the potato cells are the same: the potato and the solution are isotonic. On my graph this is given to be 0.24 Moles: this is when the sugar solution is diluted with distilled water so that it is 0.24 moles in concentration. There is the possibility that a straight line of best fit is incorrect and this would alter the amount.
I predicted that the higher the sugar concentration, the more water will transfer from the potato into the sucrose solution making the potato decrease in mass and length, and vice versa for a lower sugar concentrations. I also predicted that if a sample floats in the solution then it will gain weight and osmosise and if it sinks then the potato will ex-osmosise.
The first part of my predication (When two such solutions are divided by a semi-permeable membrane the water will move from the area of high concentration to the area of low concentration, until both sides are equal (have reached equilibrium), was accurate with my results and graph as the more concentrated the sugar solution, the lower the percentage change in mass was. The opposite is also true: that the lower concentrations have a higher percentage change in mass. It was not possible to predict what the concentration in moles would be where the concentration of water molecules inside and outside of the potato are equal because I only had a limited amount of data from my preliminary experiment and that amount was not enough to predict or educated guess at what the amount would be. The floating and sinking of the potato chips was just a curious observation from the preliminary experiment that proved to be more or less true within the final experiment: some of the chips behaved in the predicted way but there were some variations with some being half way in-between. There was even discrepancy between potato chips in the same concentration of sugar solution proving that not only the sugar solution is effecting this. I believe that the way in which the potato chip is placed into the test tube may have something to do with it as if it was stuck to the side this may effect its ‘floating rate’. There are of course many other factors that could influence this but none are important to the main point of the experiment.
The investigation has shown me that mass percentage loss and gain are proportional to the concentration of sugar solution. I was not sure of this before and could not predict anything from my preliminary work as I only trailed two of the concentrations: not enough to do a basic graph. The investigation has not proved with absolute certainty that the concentration I have discovered for the water particle concentration being the same both inside and outside the potato cell, is absolutely certain and as I cannot find the exact information that I am looking for through any other sources, I will have to be content with my result and take into account experimental error.
Evaluation
I believe that the experiment produced reasonable results although there were some differences within the concentrations, which could have affected the final percentage, but as an average of the percentage change was taken, I do not believe that it would have altered it too much.
The drying of the potato chip to remove excess surface water may have led to an inaccuracy in the results as there was no obvious way to standardise this and therefore some of the chips may have been more dry than others which would have lead to alterations in the weight.
There may have been an alteration in the temperature of the room that we were not aware off that could have made the test unfair but it would have been so slight that I doubt that it would have made much of an impact.
If we had the time and resources to repeat the experiment another three times, I believe that it would have been more accurate as any anomalous readings would have been nearly compensated for by the taking of an average from six results whereas from only three, an anonymous reading may have still caused an average to be off.
The straight line on my graph is a line of best fit that only goes through one point exactly (0.0) and another very nearly (0.2). The other four are spaced approximately evenly either side of the line. I believe that the line should have been truly straight with all off the points on it but due to experimental error (error that is undistinguishable) they are not in a line. There is one point (0.6), which seems to be more off than the others but I cannot determine an obvious cause of this error (although in my results table this is one of two that had a great difference between percentage change in mass in each of the run-throughs). There are no averages that are too far out indicating that the results are fairly accurate: there is not too much variability.
The results in my results table are fairly similar within the concentrations with the maximum difference only being 5 percent between runs in each concentration. I would have preferred if it was less but there was not time to repeat the experiment over any more times.
I am confident about my values, trend and therefore my conclusions to the extent that I believe the negative correlation trend to be accurate. I am not completely positive that a straight line is truly the line of best fit and I am also not sure as to whether my line is accurate as it is difficult to plot a straight line of best fit. If my results were slightly different I may have decided to draw a curve but then this would not fit in with the logic that mass percentage loss and gain are directly proportional to the concentration of sugar solution. I also had to round off my average percentage change in mass to make it fit onto graph paper and also be easier to draw: two decimal places were rounded off to one which has made my graph and therefore possibly my conclusions less accurate.
To continue the experiment further I would like to have been able to do more concentrations and to actually test out the conclusion that there would be 0 percentage change with a solution of 0.24 moles. It would also improve accuracy to have repeated the experiment with perhaps different lengths and diameters of potato chips: as we are measuring percentage change then the size would not matter if the whole experiment was re-run with the same size and then the results compared to the experiment which has been done.
Secondary sources include:
Biology lessons
Internet (various biology and coursework sites)
Encyclopaedias
Textbooks (various but mainly The Living World by Michael Roberts)