Method
- Set up equipment (as below)
- Put 1 heaped spatula of sodium bicarbonate in water
- Place light 25cm from the boiling tube
- Switch light on
- Count No. Of bubbles released for 1 min
- Record in results table
- Repeat 2-6 twice
- Repeat 2-7 but decrease distance between boiling tube and pond weed to 20cm, 15cm, 10cm, 5cm and finally 0cm
Equipment
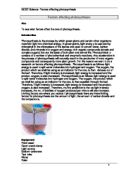
- Pond weed (plant)
- Light Bulb
- Measuring Cylinder
- Boiling Tube
- Clamp stand/clamp
-
Sodium Bicarbonate (releases CO2 - used in photosynthesis)
- Stop watch
- Thermometer
- Spatula
- Metre rule
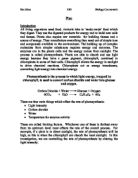
Diagram
Fair test
To make this a fair test, there are a number of things which have to be controlled. The amount of sodium bicarbonate needs to remain constant to give a specific volume of carbon dioxide. I will use a heaped spatula. The temperature of the water and volume of water will have to be constant. The temperature will remain at room temperature, around 23 degrees C, and the volume of water at 40cm3. The amount light shining on to the experiment needs to be controlled, so the blinds were put down and the lights were turned off, and the lamps will be the only source of light.
Variation
The only variable in this investigation is light intensity. Altering the distance between the light bulb and the pondweed in the boiling tube will do this.
Measurements
Prediction
I predict that as light intensity increases, so will the rate of photosynthesis. Therefore the closer the light bulb is to the pondweed; the more bubbles should be produced from the stem. I think this because as the light bulb moves towards the pondweed, the light intensity increases, and therefore so should the rate of photosynthesis. This is why plants photosynthesize during the day and not during the night.
Before planning this investigation, we completed a trial experiment. The purpose of this was to give us an idea of the experiment we were going to do. This meant that we could avoid making mistakes mid-investigation, and also finding results which do not accurately represent what should occur.
Obtaining Evidence
To make the experiment as accurate possible I made sure all measurements were the same and made sure that the constants did not vary. If for any reason something didn’t go to plan, that particular experiment was repeated and not recorded.
No sunlight came in, and the only light that was in the room was that of the lamps. After each experiment the boiling tube was emptied of water and sodium bicarbonate and refilled, making sure that every time the boiling tube contained the same quantities. I also left the fresh water a couple of minutes before adding the sodium bicarbonate, so the pondweed could get used to the water around it. The measuring cylinder was emptied completely of water making sure there was exactly 40cm3. The metre rule was taped to the table so that the distance between the lamp and the weed was accurately controlled.
Analysing
I have found that as the distance between the light source and the weed is decreased, the more bubbles are produced. This therefore shows that as light intensity increases, so does the rate of photosynthesis.
Results
My graph shows negative correlation between the distance between the light bulb and the weed and the rate of photosynthesis. This however does mean that there is positive correlation between light intensity and the rate of photosynthesis. My results show a definite trend.
The best fit line on the graph gets gradually steeper, which perhaps suggests that the light intensity and the rate of photosynthesis might not be directly proportional, and perhaps there are other factors to consider, e.g. the carbon dioxide being released.
My results do support my prediction. “I predict that as light intensity increases, so will the rate of photosynthesis”. Therefore my results should show me that the closer the light bulb is to the pond weed, the more bubbles are produced form its stem”.
Evaluation
I think my results are quite good, but I could have made them more accurate. However, they do show that light intensity does have an effect on the rate of photosynthesis, which was our original aim.
My method was good and I did not have to make any alterations. However, I did encounter a few problems. When the light source was 0cm away from the light source, it was very difficult to count the bubbles being released because of the harsh light on my eyes. This may have meant that the number of bubbles I counted was inaccurate.
The only anomalous results we received were at the very beginning of the investigation. At first no bubbles were produced, so we changed for a different piece of pondweed. Fortunately the 2nd piece of pondweed worked well. The anomalous results were not included in the results table.
If I did the experiment again to get better results, I would find a wider range of results and repeat each experiment three times. I would also move the pondweed by 2.5cm rather than 5cm. I couldn’t do this originally because there wasn’t enough time.
My results allow me to reach a conclusion. If I were asked to make a prediction of how many bubbles would be released with a distance between the light source and weed of 12.5cm I could use my trend line and make an accurate prediction.
To get more evidence to support my theory I would change the variable. I would perhaps alter the amount of sodium bicarbonate, but keep the light intensity constant. This would give me a broader idea on what factors affect the rate of photosynthesis.
If I did extend the enquiry I think I would find that the rate of photosynthesis could be changed by a number of factors, each partly in control of the overall process.