Depending on whether my experiment goes according to plan and if I have enough time, I will repeat the experiment but changing the volume of NaHCO2 to make it a 0.4% solution. I will be using an identical method.
I will record my results in a table and then use this table to make various graphs to try to extract a trend/pattern so as to be able to analyse, conclude and evaluate accurately. Altogether, I will be recording 10 readings (15 readings if I do go ahead with the repeat).
After I have completed the experiment, I will clear away my equipment safely and neatly. I will have to wear an overall to protect my clothes and also a pair of goggles so as to protect my eyes in case the solution splashes anywhere.
Fair testing:
The following will be kept constant to make the test a fair one:
- The equipment e.g. cups, thermometers and so on, so as to make sure that the conditions, amounts and factors such as temperature are kept the same.
- The room temperature (*C) so excess heat from outside does not stimulate the rate of photosynthesis, speeding it up.
The volume of water; the elodea; the pH of the solution; the amount of the NaHCO (except for when I may be doing my repeat, using a 0.4% solution, but this does not affect the 0.2% solution as I will have completed that test before I start the 0.4% solution), and the temperature of the room. We can open windows to try and level the temperature of heat from the lights unbalances it. These are our constants.
The light from the bulb being applied to the weed will be the independent variable, as I will be manipulating it.
Also, the black paper around the cylinder will be controlling how much light is let into the cylinder.
N.B - variables:
-
Factors like timing (i.e. when we will take the readings and how long for) are our independent variables – this being the type of factor we will change step-by-step, deliberately.
-
Our readings (results) are the dependant variables – the size or amount of this depends on the first reading.
-
All of the other variables will be our constants – they will be kept under control.
Obtaining
Preliminary experiments:
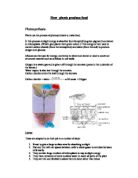
Experiments I have done before this experiment include testing a leaf to see if light is necessary for photosynthesis and testing a leaf to see if carbon dioxide is needed for photosynthesis. The first was done by leaving a leaf in a cupboard to de-starch it and then cover it with a strip of black paper or foil with some sort of shape cut out of it and then leave it the path of sunlight for a few days and then test it for starch. The latter was done by de-starching a plant and put a leaf on one side of the plant in an air-tight test tube with a small amount of distilled water in it and another leaf in an air-tight test tube with the same amount of potassium hydroxide solution and leave the plant in a sunny area for a few days and then test it for starch.
When I was doing the first reading for the 0.2% solution, there were no problems with the experiment – it went exactly according to plan and there is no need to change any of the Planning section or the method, which I am pleased about.
Results:
The readings in the above table show the amount of bubbles after 5 minutes.
From this table I was able to calculate the light intensity, which would be to divide 1 by the distance squared and then say for example the distance is 10cm, it would be 0.01 so, to write that in standard form would be 100 x 10 so that would be the light intensity for the light applied at a distance of 10cm away from the elodea.
This will help me to plot a graph showing light intensity at different distances.
To show this for all 5 distances, I have decided to put it in a table to show light intensity.
Graph(s):
See graph paper.
Observing:
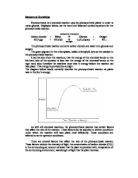
At the beginning, the average number of bubbles per minute for the 0.2% solution did not differ greatly from that of the 0.4% solution (76.8 and 79) and therefore the end result being 29.8 and 27. This is probably why, visually, the graphs look similar, because all of the graphs look extremely similar with trend, pattern and size. My graphs show the drop in the number of bubbles in proportion to the drop in light intensity.
means 1 divided by the [distance squared]. This makes it easier to plot on a graph and it enables us to show the answer in standard form (e.g. 6.25 x 10 ) which is far more readable than 0.000625. In observation, in the table above, the number that has to be multiplied by 10 goes from 100 to 11, and then to 4. This also shows that the as the amount of concentrated light moves further away, the number of oxygen bubbles produced (representing the rate of photosynthesis) decreases to show that for the process of photosynthesis to work quickly, light is a necessity.
Analysing and Concluding
Analysis:
Looking over my graphs, I can see a few anomalous results, which are not that far off the mark, however there is one particular result which is far away from the line: it is on the graph which shows the 2nd reading of the 0.2% solution at 20cm distance. I am displeased with that as I am inclined to think that some major error was made, however, it could just be simple like a timing error (i.e. I looked at the stopclock a bit late or a bit early), or maybe I miscounted the bubbles.
All the graphs have the same kind of shape.
This indicates that the results are reliable seeing as they all have the same shape and no more then one anomalous result per graph. For example, if some of the graphs had curves the same as or similar to the above graph, and some differentiated completely or at least noticeably, then I would know that I had gone seriously wrong somewhere with the method or the solution volume or some other factor in the experiment. Thankfully, my plant worked extremely reliably so I can depend on that for good results. In my table (pg.4), it shows that as the lamp is moved further away, the numbers of bubbles decrease. The shape of the curve shows that at first the number of bubbles is very high, then, as you move the lamp away, it curves down. After that, at about 40cm, the difference of the number of bubbles is far smaller then at the beginning. This suggests that when the light source (lamp) is moved from 40 – 50cm away from the plant, the light intensity is not used as much because the plant starts to use its reserved energy rather than rely on the light source as much but it still uses as much light as it can get and the process of photosynthesis evens out, which is shown by the straighter part of the curved line at the end. This backs up my prediction: that the higher the light intensity (i.e. the closer the light source is to the plant), then the faster the rate of photosynthesis, proving that:
- light is a necessity for photosynthesis to occur
- oxygen is produced during photosynthesis.
Conclusion: To conclude, my experiment has gone really successfully and I appreciate my plant working well, otherwise I would have had to start again with another plant, which would have given me less time to do my experiment.
My results table shows a considerable drop between the number of bubbles at each set distance and in the averages for each, that is also shown in the curve on my graphs. This shows that my experiment went according to plan and I am happy that there were no faults as such in my method. The two issues that needed to be proved (as that was the purpose of the experiment) were that oxygen is produced during photosynthesis and that light is needed for photosynthesis to occur. This first was proved by the oxygen bubbles I counted, and the second was proved by the amount of oxygen bubbles decreasing as the light source was moved further away from the elodea. This proves that my prediction was correct.
However, my results for the 1st and 2nd readings of the 0.2% solution and of the 0.4% solution do not differ a lot which makes me think that maybe something like the volume of the solution was not entirely accurate because I think that a 0.2% change in the volume of the solution (which is in fact, doubling the amount of NaHCO2) should have some evident effect on the amount of bubbles produced, either slowing down the process of photosynthesis or speeding it up. My results, unfortunately tell me that the extra NaHCO2 had little to no effect (or evident effect) on the rate of photosynthesis. I cannot be sure what caused this, how or why, but I can put it down to the following: change in room temperature, a ‘faulty’ plant or a possible mistake I may have made whilst measuring the NaHCO2, however I am sure I measured everything out correctly or I would have realised at the time. However, it did not affect the most important part of my experiment: with the 0.2% solution, which I am happy to say went extremely well.
Evaluation
Fair testing?
The experiment was conducted safely and fairly. The apparatus I used was safe and worked efficiently and I used the same equipment throughout the experiment. I tried to keep the room temperature the same by opening the windows to let out the excess heat. This is because there was a significant rise in room temperature because of the heat given off by my light and also from the lights being used around me for other people’s experiments. I kept the timing for the amount of time before and after each reading for each distance was taken (after 5 minutes for each distance – there were 5 different distances). This was to ensure that I had as few anomalous results as possible and to make that results easy to analyse, conclude and draw up in a table and on various graphs.
Accurate and reliable results?
I think that a large proportion of my results are accurate, therefore are reliable but the anomalous results suggest that somewhere I have gone wrong with timing or maybe I miscounted the bubbles at some point e.g. at 30cm on the 1st reading of the 0.2% solution. However, the number of bubbles could have increased at some point more dramatically because of a rise in temperature on the outside (room temperature) causing the rate of photosynthesis to become unbalanced.
I cannot see any anomalous results that are really far off the mark other than that of the reading for 20cm on the 2nd reading of the 0.2% solution. This indicates that my results are reliable.
The experiment was difficult to complete because there was so much to do and find out and I think I probably could have spent hours doing more of it because no matter how much or how little you did, there was always something else you could do (e.g. change the temperature of the solution, the pH of the solution, the concentration - % - of the solution and so on), and I would have liked to be able to experiment a bit more, given the time.
Possibilities for other experiments include using the concept and basics of this experiment but changing the NaHCO2 to something other like potassium hydroxide solution perhaps. Maybe we could use a plant under conditions in which we could measure the amount of carbon dioxide (CO2) taken in and the amount of oxygen given off and compare the two to see what kind of difference there is and why.