The maximum rate of photosynthesis will be constrained by a limiting factor. This factor will prevent the rate of photosynthesis from rising above a certain level even if other conditions needed for photosynthesis are improved. This limiting factor will control the maximum possible rate of the photosynthetic reaction.
For instance, increasing the temperature from 10°C to 20°C could double the rate of photosynthesis as the plant's enzymes will be closer to their optimum working temperature (, which is approximately 37oc). As the temperature is increased, molecules in the cells will be moving at a faster rate due to kinetic theory. If the temperature is raised above a certain level (around 45oc, the rate of photosynthesis will drop as the plant's enzymes are denatured.
The amount of water available to the plant will affect the rate of photosynthesis. If the plant does not have enough water, the plant's stomata will shut and the plant will be deprived of CO2. It is difficult in normal lab conditions to prove that water directly affects photosynthesis unless a heavy isotope is used to trace the path of water.
Chlorophyll is needed for photosynthesis. This can be proved by studying a variegated leaf. It is however very difficult to study how different levels of chlorophyll in the plant will affect it's photosynthesis rate. This is because in a variegated leaf the cells either contain chlorophyll or they don't.
Carbon dioxide concentration will directly affect the rate of photosynthesis as it is used in the photosynthesis reaction.
Source: Compton’s Interactive Encyclopedia, Encarta 97, Letts GCSE Biology Study Guide and CGP GCSE Double Science revision guide.
Hypothesis
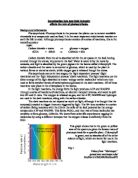
Based on the research I have done on photosynthesis I have found out that the light intensity affects photosynthesis because the chlorophyll in plants uses light energy to perform photosynthesis. So based on this information I predict that if the light intensity level is raised, the rate of photosynthesis will increase steadily but I think this will only be up to a certain point. Beyond that point I don’t think it will make any difference because then it will be either the temperature or the CO2 level, which will be the limiting factor. I believe that the light intensity will be directly proportional to the rate of photosynthesis and this will be demonstrated in the graph. Based on this prediction, below is my prediction of what the graph would look like:
Analysis of results
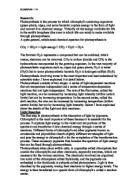
The following balanced equation is for photosynthesis:
Carbon Dioxide + Water Glucose + Oxygen + Water
6 CO2 + 12H2O C6H12O6 + 6O2 + 6H2O
Based on this equation you can see that the factors limiting photosynthesis are the temperature, the carbon dioxide concentration or the light intensity. The temperature affects the chlorophyll, which uses light energy in sunlight to convert CO2 and water into glucose. The chlorophyll is very similar to an enzyme in the way that it works best at an optimum temperature that is warm but not too hot. The carbon dioxide concentration affects photosynthesis because it is needed by the chlorophyll to produce the glucose.
In this experiment the factor of light has been used to experiment with. Light is one of the main factors to photosynthesis that it could not work without. The extreme importance of light energy to photosynthesis has been shown through this experiment. Light intensity affects photosynthesis because light energy is required in order for the plant to photosynthesize.
From looking at the evidence displayed in the table I can see that the further the distance (in cm) of the lamp from the beaker (or the weaker the light intensity), the lower the number of bubbles counted, (or the slower the rate of photosynthesis). This can also be seen by the line of best fit on the graph, which is a curve.
By looking at the graph you can see that at 25cm on the graph the line of best fit goes upwards, but if results were taken down for any of the distances before 25cm I think you would find that the results would level off into a plateau of a straight horizontal line. This suggests that the optimum light intensity for photosynthesis is around 25cm and if lamp were any closer to the beaker than the optimum distance, it wouldn’t make any difference because now it would be either the CO2 or the temperature that will be the limiting factor. I believe that this shows that the results were recorded from 25cm because at around this distance is the optimum light intensity for photosynthesis. On the last result shown on the graph, at 80cm, the line of best fit seems to be now coming down also at a plateau. If you were to carry on the experiment I believe that you would find that the results would decrease steadily and finally reach 0 as the average amount of bubbles counted.
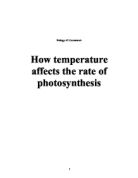
Below I have shown a simple diagram of what the full graph would look like if the full possible range of results were taken down:
I think the graph that was produced from the results I was given is just a section of this graph above.
When examining the graph I have found that it is an inverse proportion graph, so the formula for this graph is that the number of bubbles is inversely proportional to the distance:
No. Of _______
Bubbles Distance
The fact that the graph turned out to be inversely proportional took me by surprise because I had predicted that the graph would be directly proportional in my hypothesis! The reason for my faulty prediction is that as you go down the X-axis in the graph you find that the light intensity is in fact being decreased because the distance is being increased. So we can even say that the distance is inversely proportional to the light intensity:
Distance ______________
Light Intensity
In my hypothesis I didn’t take this fact into consideration and realise this, which is why I predicted the graph to look exactly opposite and be inversely proportional. But the basis of my prediction was correct.
But the fact that the graph is an inverse proportion graph and the fact that the number of bubbles counted is inversely proportional to the distance of the lamp from the plant, means that if you increase one the other will go down and therefore, if you decrease one the other will go up. So for this graph when the distance is increased the number of bubbles decrease, showing a slower rate of photosynthesis for a lower light intensity. In the same way if the distance is decreased then the number of bubbles increase, showing a faster rate of photosynthesis for a higher light intensity. This was what I had predicted in my hypothesis. Before the experiment I had expected a directly proportional graph that was a straight-line graph. But the fact that it turned out to be an inversely proportional graph is the reason for the line of best fit to be a curve rather than a straight line as I had predicted. If it had been a graph plotting the light intensity against the rate of photosynthesis I strongly believe you would find that it would be a directly proportional graph. But this is no reason why the graph has come out with a curve instead of a straight line, it can still be straight lined in the middle and still be inversely proportional. The reason a curve was produced rather than a straight line could be because of the heat being radiated from the bulb playing a part. As I have said before temperature is one of the main factors that affect photosynthesis. If you look at the graph you can say that the closer the lamp is to the beaker the more bubbles are counted. This could be because of the heat that is given off by the bulb when it is closer, is speeding up the rate of photosynthesis and obviously the further you get the less heat is available. The heat is relatively low so it will only be affecting the plant up to a certain distance, but this is enough to cause the curve because of this inconsistency in controlling the other factors.
Another possible reason for the curve could be that although the X-axis is for the distance and the points between the distances are equal, this is not the equal measurement for light intensity. For example on the X-axis the first point is 25cm then it goes up to 30cm and then 35cm, always going up by 5cm. But this is NOT a measurement of the light intensity, only of the distance between the lamp and the plant. The measurement of light intensity would not be exactly the same between 25-30cm as it would be between 30-35cm. This difference in measurements of the light intensity could be, in my opinion, be very significant to why the line of best fit is a curve and not a straight line. How it is significant is that, because the results that have been received back are relatively scattered because the range of the light intensity differs between each two distances. If the light intensity was measured out correctly and the distance was determined and the results were plotted on those distances I believe you would find the line of best fit would be a straight line that levels off after a while.
The curve could also be the outcome of other factors such as perhaps external light disrupting the experiment. For example a change in weather could have brightened up for certain amounts of time not giving clear enough results to plot a straight line of best fit but muddled results that would have to have a curved line of best fit.
Overall, the anomaly found for 50cm, did not disrupt the results too much and despite this minor defect I do not consider these results too be unreliable and find it possible to draw a conclusion from them. I have found from the results that the higher the light intensity the higher the rate of photosynthesis, but this is only up to a certain point because if the light intensity is any higher it wont make any difference because then it would be the CO2 or the temperature which is the limiting factor. This point was not completely proved in this experiment, so my suggestion for an improvement to this experiment is to collect a much larger range of results so a more fuller graph can be produced instead of what has happened here, which is only a section of the results have been collected and so only a section of the graph can be produced. This conclusion is close to my prediction, so I am happy with the outcome of this experiment.
In my hypothesis I predicted that that if the light intensity level is raised, the rate of photosynthesis will increase steadily but this would only be up to a certain point. Beyond that point I didn’t think it would make any difference because then it would be either the temperature or the CO2 level, which would be the limiting factor. This prediction seems to be correct and as you can see in the graph that the shorter the distance (and the higher the light intensity) the higher the number of bubbles (and the faster the rate of photosynthesis.) You can also see the steady decrease in the curve. The point where either the temperature or the CO2 level has become the limiting factor is not shown on this graph so my prediction that it will level off has not yet been proved through this experiment. I also predicted that the light intensity will be directly proportional to the rate of photosynthesis and this would be demonstrated in the graph. This was incorrect as it was in fact the distance being plotted against the rate of photosynthesis rather than the light intensity, which caused the graph to be inversely proportional. So overall, I feel the conclusion I have come to supports my prediction. There were a few things that were wrong, such as the prediction about the graph. There were also things that were not proved by this experiment, such as the leveling off of the graph after the CO2 level or temperature level became limited but overall, as I said before I am generally pleased with the results of the experiment being similar to my prediction.
Evaluation of results
In my opinion the experiment on the whole, seems to have gone well and the results are generally correct. But there are some anomalies, which has spoiled the results. It has especially affected the graph, as the whole line of best fit had to be moved upwards because of the 50cm anomaly. This anomaly was caused by an inconsistency in one of the runs for that particular light intensity. When looking back at the procedure used I found that there were a lot wrong with that particular method of gas collection and it wasn’t very suitable. The method that was used for this experiment was counting bubbles. Other methods of gas collection would be involving the use of a gas syringe or simply measuring how much gas was released from the plant. But I don’t think that the gas syringe method is very suitable because there will only be a limited amount of gas released in photosynthesis and not enough to use a gas syringe. The gas collection method of measuring how much gas was released from the plant is probably the best method. The importance of light to photosynthesis can be tested using the test involving the use of opaque paper clipped on to both sides of a leaf on a green plant, but this test wont show the effect of varying the light intensity on photosynthesis.
The anomaly at 50cm has arisen because one of the factors that were supposed to be controlled in the experiment was not. Those factors were:
Measuring the distance
The exact, precise measurement should have been made between the edge of the beaker and the lamp. It is possible that during one of the runs the measurement could have been incorrect, which could have led to the anomaly.
Bubbles counted
A mistake could have been made while counting the bubbles. Also, some of the bubbles could have been hidden behind other bubbles. Bubbles could even have been released so fast that the person collecting the data could have missed it if they blinked.
Nature of bubbles
For the anomalous result, what could have happened regarding the nature (size) of the bubbles is that, very large bubbles could have been released for one distance, while for the other lots of small bubbles could have been released, which could be the reason for the anomaly.
Temperature
The temperature is one of the factors that affect the rate of reaction. This could either be the temperature of the water or the room temperature. The room temperature is the main factor because if it changes the water temperature it is most likely to change as well. All the runs in the experiment should have been carried out in the same room temperature to make the test fair. What could have happened during the run containing the anomaly is that a draft could have entered the room and decreased the temperature or the temperature could have gone up if a radiator had been switched on at that time.
Also the heat being radiated from the bulb could have affected the results. This could be because of the heat that is given off by the bulb, which affects the plant when it is closer, speeding up the rate of photosynthesis and could have been the cause of the anomaly.
Equipment
All equipment should have been exactly the same in all the runs in this experiment. A minor change such as the a different beaker could have greatly influenced the results or if a different lamp had been used it could have had a more powerful bulb in it, which means the light intensity would have been much greater than thought and could be the reason for the anomaly.
Other light
External light could have caused some huge problems during this experiment. I wouldn’t be surprised if this was the reason for the anomaly. If you look at the anomalous result at 50cm distance, you will see that it has worked at a slightly higher rate of photosynthesis than it should have. A simple explanation for the anomaly in relation to ‘other light’ is that the weather could have brightened up just for a certain amount of time allowing a lot of external light to shine on the plant and further increase its light intensity at the time of taking down the results for 50cm.
Below is an improved diagram for a new improved experiment that is designed to be more successful.
If I were allowed to suggest improvements for a new method I would make the following adjustments:
- Use a more suitable method of gas collection
- As I have explained before I discovered that there were a lot of things that could go wrong with the method of counting bubbles. I feel that instead measuring the amount of gas released would be a much more efficient and superior method
- Collect a bigger range of results
-This would mean I could get a more extended, fuller graph and can draw more conclusions from it and can also see to what extent my prediction is true.
-Doing a high number of runs will further reduce the chance of anomalies
- Carry out measurements to a higher degree of accuracy
-If all measurements are taken with the utmost care and accuracy there shouldn’t be a problem
- Use a larger group of people to do the experiment
- I was not informed on the number of people that participated in the experiment but a larger group would be much more ideal, as there would be more people to do jobs and give back up opinions on things like measurements.
- Make sure the same person does each job
-This is quite important because for example when one person does the measurements of the distance they may have a certain way of doing it i.e. measuring from the back of the base of the beaker up to the front of the base of the lamp, while another person may just measure from the front of the beaker to the front of the lamp. So it is essential that there is one fixed person assigned for each job.
- Use a heat filter on the lamp
- This is to ensure the heat radiated from the bulb will not affect the plant.
- Make sure the light is shining on the same spot at all distances
- This is just to make sure it’s a fair test because some leaves on one side of the plant may be facing towards the lamp and so will absorb more light energy, while on another side the leaves may be facing upwards and will not absorb as much light energy. Also, if the light shines on different leaves with different surface areas this will also mean the test is unfair. So based on this information it is essential that the lamp is shined on the same spot of the plant.
- Measure the distances to a higher accuracy
-A more accurate ruler or tape measurer could be used to measure the
distance between the beaker and the lamp ensuring the measurement
start and finish at the exact same points for each length. Also, more
than one person should be involved in taking down the measurement
so there will be extra people to double-check the results and cut out any anomalies.
- Collect accurate evidence
-Again make sure that more than one person is in charge of recording down these results so there will be someone to double-check.
- Make sure the temperature remains constant
-To completely ensure that this factor is kept constant a thermometer
can be kept close by and checked regularly before each run to make
sure the room is at a constant temperature. Doing things like shutting
windows, doors, covering air vents, shutting off radiators, fans and doing all the runs in the same room will greatly help in keeping this factor constant.
- Use the same equipment throughout the whole experiment
-If all the equipment is exactly the same for each run there shouldn’t
be a problem here. For example the same plant must be used
throughout the whole experiment, because if a different plant was
used the surface area of the leaves may be different or it may contain a
different amount of chlorophyll rendering the experiment unfair.
- Control over external light
-External light such as the light in the room and the light coming in from the sun will have to be kept constant. The light in the room shouldn’t be too much of a problem because it should remain constant. The main problem is with the light from the sun. Keeping the external light factor constant may involve doing the experiment with the curtains pulled together or doing it in a room with no windows
Another big problem that may have occurred and could be the reason for the anomaly is human error. I believe the way to get past this is to, as I have stated before is to get more people in the group to work on the experiment so there will be more opinions and more accuracy and less room for human error.