Apparatus List
- Beaker
- Boiling Tube
- Plasticine
- Tweezers
- Thermometer
- Scissors
- Lamp
- Metre Rule
- Light meter/comparator
- Stopwatch
- 1% NaHCO3 solution
- Elodea Canadensis
- Light Intensity Meter
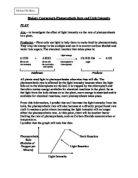
Diagram
Range of Measurements
After carrying out a preliminary experiment, I have decided upon the range of measurements I want to use. In my preliminary experiment, I performed the task but with no measurements taken. I just wanted to test to see if it worked at the different distances. I found that a lot of bubbles were produced when the lamp was very close to the Elodea, but when I moved it away to a considerable distance there were very few if any bubbles produced at all. So I have decided on my range, which is going to be:
- 20mm, 40mm, 60mm, 80mm, 100mm.
I have chosen this range because I think, that 20mm is the closest I can get the lamp to the stem, and 100mm was around about the place where there seemed to be very little bubbles being produced in my preliminary experiment. I think the intervals I have chosen are suitable as well because there will be a difference between the results, which will allow me to draw a graph of the results.
Measuring Techniques
I am going to use the pencil dot technique to count the amount of bubbles of oxygen produced in this reaction. This is when I put a dot on a piece of paper every time I see a bubble and when the minute is up, I count the number of dots on the paper. However I have to make sure I go down the paper so the dots are not all in one spot and hard to count. This technique should give me an accurate reading, and then I can repeat each distance twice more for extra reliability.
Variables
Dependant Variable-This is going to be the amount of oxygen bubbles that are produced per minute.
Independent Variable-This is the light intensity, which I will change by increasing or decreasing the distance the lamp is from the Elodea in the boiling tube.
Controlled Variables-These are the things I will keep constant to make sure it is a fair test and the results I get are accurate.
⇒Elodea plant-The only way to keep this constant is to use the same piece of Elodea each time I carry out the experiment. This is because plants of different species have different photosynthetic rates, and even plants of the same species have slightly different rates because of their different leaf structures and also the size of their leaves because the gas exchanged depends on the surface area.
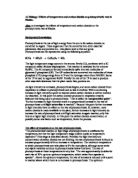
⇒Temperature-I intend to keep this at room temperature, which is constant although not very accurate. This is because enzyme reactions will increase along with the photosynthetic rate if I increase temperature, and the enzymes will denature when they get to a certain point. This graph shows this:
Temperature
⇒Water-Water is required for a photosynthetic reaction to take place. This is because it provides the carbon dioxide that is not already dissolved in the water, which is not enough to produce a visible reaction. Water can be kept at a constant by keeping the same amount in the boiling tube.
⇒Light Wavelength (Colour)-Chlorophyll pigments in a leaf absorbs the light energy. Chlorophyll easily absorbs blue and red light, but it does not absorb yellow and green effectively. It tends to reflect the light, so it is not absorbed and the rate of photosynthesis is decreased. In this experiment, I am investigating why the rate of photosynthesis increases or decreases with the amount of light energy absorbed. I will keep this constant by using the same lamp during the experiment.
⇒Carbon Dioxide-This can affect the photosynthetic rate because the more of it in the air, the more that can diffuse into the Elodea. To keep this variable constant, I need to put a fixed amount of sodium hydrogen carbonate into the boiling tube along with the water and the plant.
OBTAINING EVIDENCE
I carried out my plan to the best of my ability and these are the results I came up with:
I used my three sets of results, which are in the centre three boxes, to create average results in the column on the far right. I am going to use theses results to draw my graphs. I will draw one graph with using distance as x-axes, and on the other graph I am going to use light intensity, the results of which are shown here:
ANALYSIS
I have drawn two graphs to show my results. The first graph shows the distance of the lamp from the Elodea on the x-axes and the average number of O2 bubbles produced per minute on the y-axes. I have drawn a line of best fit, as the results that I have found should be directly proportional.
The first graph shows that as I increase the distance between the lamp and the Elodea, the fewer O2 bubbles that are produced. This is because the further the lamp is from the plant, the lesser amount of energy that is available for the photosynthesis. This meant that the rate of photosynthesis slowed down. This is shown on the graph by the line being a negative and having a gradient of -0.11.
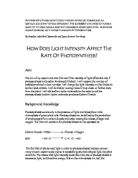
In my second graph, the line of best fit shows that the bigger the light intensity, the quicker the photosynthetic rate. The light is what provides the energy for photosynthesis, so the more light energy provided, the bigger the number of oxygen bubbles that are produced as a result of this photosynthetic reaction. I have shown in this graph as the line has a positive gradient of 0.22. This supports my prediction where I said that ‘as I increase the light intensity from the bulb, the photosynthetic rate will also increase at a directly proportional rate’.
As the light intensity gets to an optimum, the photosynthetic rate starts to be limited by other factors such as temperature or carbon dioxide levels. These factors do not limit the rate immediately but over a period of time get to a point where they completely limit the rate of photosynthesis. This would be shown by a plateau at the top of the graph; however my results were not accurate enough for this plateau to be shown. This would be something I would look for if I were to do this again, so that I knew my results were accurate.
I researched this reaction on a website and found that a higher light intensity produces a greater level of light energy, which can be converted in a special protein environment. Here the energy of a photon is used to transfer electrons from one chlorophyll pigment to another. When enough energy has been collected at a reaction site, ATP can be synthesised from ADP. The oxygen produced is a by-product of this reaction, so the more light energy, the more ADP that is converted into ATP and therefore more oxygen is made as a by-product.
EVALUATION
I have carried out this experiment to the best of my ability and repeated it several times for reliability so that I got the most accurate results I could. My lines of best fit seemed to fit reasonably well, but I am not sure whether the numbers of oxygen bubbles produced were what they were supposed to be in general. The only way to find this out would be to redo the experiment several times again and give the Elodea more time to equilibrate. Also I thought there were several inaccuracies with the experiment, which did not help in producing reliable results.
The first thing is the distance of the lamp from the Elodea, which was not entirely accurate although I used a ruler. The position of the elodea in the boiling tube could have affected how far away the lamp was.
The second thing is the heat that is generated by the lamp, which can quite easily affect the rate of photosynthesis in the plant. As the length of the experiment wasn’t really long enough for me to notice a difference, it did not cause much of a problem. However if I was to hold the lamp to the water in the beaker for longer, it might start to rise the temperature, thus affecting the rate of photosynthesis. One way to prevent this problem would be to hold a Perspex block in front of the beaker to absorb the heat, but allow the light energy through to the plant.
Another thing would be the time keeping of the experiment. I did not really allow time for the elodea to equilibrate to the light intensity and so the number of O2 bubbles was probably less than expected. I was also unsure as to when to start my timing, whether it be as soon as I see a bubble produced or just at a random point but whatever I did, I would have to keep constant to make my results reliable. I decided upon doing when I see a bubble rise so then I would know that the Elodea has at least equilibrated a little bit.
To improve the quality of the data, I could perform the experiment using a syringe and capillary tube, so that the bubbles form one bubble and then I can measure the volume of the bubble. I can do this because I know the size of the tube so it just depends on the length. This is how it would be set up:
If I was to do this again, I would make sure I give the plant the time it needs to equilibrate and use the improvements I suggested. I would maybe also extend my range of results to a further distance, although the reason I didn’t this time was because the number of oxygen bubbles produced was so low I didn’t think anymore would be produced at a lower light intensity.