Introduction:
I have been presented with a set of data, of which I have been given the task of analysing the data and to write a report showing what can be understood from it in relation to the physical principles involved. The task requires three hours of teaching time and roughly three hours of home work to write the analysis of the data and the report in a suitable fashion.
Aims:
* To make sense of the data of the data by showing my skills and knowledge of how to represent data to be more understandable and in a clearer fashion.
* I should identify trends and patterns, and provide explanations for the findings.
* I should concentrate on the task at hand rather than the experimental skilfulness.
Experiment Equipment:
* 1x Light Gate
* 1x Computer with suitable logging interface.
* 1x ramp - 70cm
* Books or suitable incline material.
* A trolley - 183g
* 1x Opaque card - 8cm.
Method of Experiment:
. Assemble apparatus in way shown in 'Apparatus Setup' diagram.
2. Incline ramp to correct height required using the incline material.
3. Place trolley at the top of the ramp aligned with the reference point.
4. Run program on computer and release the trolley.
5. Repeat the same height three times to ensure fair test.
6. Write down all data logged on the computer in a suitable table of results.
7. Repeat the experiment with the seven different heights and each heights repeat three times to ensure the fair test.
Apparatus Setup:
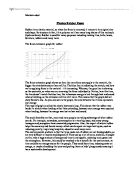
Prediction:
I predict that as the incline of the ramp increases the velocity shall increase. I suspect this because as the incline increases the gravitational energy increases therefore when the trolley is rolling down the ramp gravity acting upon it will increase as there is an increase from the ramp to the bench, therefore an increase in velocity. Although this may increase the velocity the air resistance and friction I think shall increase due to the increase of the velocity there is more air resistance acting upon the trolley and also as the trolley is rolling down the ramp at a higher speed the friction between the wheels and ramp may increase. This friction and air resistance may have a minuscule effect on the results, but still I conclude in thinking that there will be an increase in speed as the incline increases.
I have been presented with a set of data, of which I have been given the task of analysing the data and to write a report showing what can be understood from it in relation to the physical principles involved. The task requires three hours of teaching time and roughly three hours of home work to write the analysis of the data and the report in a suitable fashion.
Aims:
* To make sense of the data of the data by showing my skills and knowledge of how to represent data to be more understandable and in a clearer fashion.
* I should identify trends and patterns, and provide explanations for the findings.
* I should concentrate on the task at hand rather than the experimental skilfulness.
Experiment Equipment:
* 1x Light Gate
* 1x Computer with suitable logging interface.
* 1x ramp - 70cm
* Books or suitable incline material.
* A trolley - 183g
* 1x Opaque card - 8cm.
Method of Experiment:
. Assemble apparatus in way shown in 'Apparatus Setup' diagram.
2. Incline ramp to correct height required using the incline material.
3. Place trolley at the top of the ramp aligned with the reference point.
4. Run program on computer and release the trolley.
5. Repeat the same height three times to ensure fair test.
6. Write down all data logged on the computer in a suitable table of results.
7. Repeat the experiment with the seven different heights and each heights repeat three times to ensure the fair test.
Apparatus Setup:
Prediction:
I predict that as the incline of the ramp increases the velocity shall increase. I suspect this because as the incline increases the gravitational energy increases therefore when the trolley is rolling down the ramp gravity acting upon it will increase as there is an increase from the ramp to the bench, therefore an increase in velocity. Although this may increase the velocity the air resistance and friction I think shall increase due to the increase of the velocity there is more air resistance acting upon the trolley and also as the trolley is rolling down the ramp at a higher speed the friction between the wheels and ramp may increase. This friction and air resistance may have a minuscule effect on the results, but still I conclude in thinking that there will be an increase in speed as the incline increases.