METHOD:
- Collect all the apparatus or equipment required in order for this experiment to go ahead.
- Use the Micrometer to measure the thickness of the wire.
- Using the meter ruler measure out 2m of Constantan wire (Black, 28swg).
- Cello tape the wire across the 2m ruler. Taught the wire so it is a straight a possible but do not over do it as it possibly could make the wire become thinner.
- Connect insulated circuit wires and crocodile clips to the power pack/supply.
- Connect or attach circuit wires to the voltmeter and Ammeter.
- Place one crocodile clip on the 0cms and place the other at the point of measurement on the constantan wire. In this case every 10cm intervals.
- Record your findings to a table of results.
I will be using two different ammeters, one ranging from 0 – 1A, used for smaller readings of resistance and the other 0 – 2A, because it is better for larger readings. Overall the ammeter ranging from 0 – 1A is more accurate as it read in intervals of 0.05A while the other reads in intervals of 0.2A.
RESULTS TABLE:
SAFETY:
- Handle the power supply carefully.
- Be careful when touching the wire as it may be/get hot during the experiment.
- Start on the lowest current, so the wire will not melt or burn instantly.
- Make sure the main to the power supply is switched off each time when measuring at the 10cm intervals.
- All wire to cool between experiments as temperature effects resistance.
- Ensure the power supply is switched off before making any alterations to the circuit.
PRELIMINARY WORK:
Before carrying out the actual experiment, a preliminary test was carried out to find out how the length of a wire affects the resistance. This is so a prediction could be made and so the outcomes could be seen which may enable us to produce more accurate and reliable results on the actual experiment which follows.
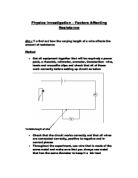
METHOD FOR PRELIMINARY TEST:
- Collect all the apparatus or equipment required in order for this experiment to go ahead.
- Using the meter ruler measure out 1m of Constantan wire (28swg).
- Cello tape the wire across the 1m ruler. Taught the wire so it is a straight a possible but do not over do it as it possibly could make the wire become thinner.
- Connect insulated circuit wires and crocodile clips to the power pack/supply.
- Connect or attach circuit wires to the voltmeter and Ammeter.
- Place one crocodile clip on the 0cms and place the other at the point of measurement on the constantan wire. In this case every 10cm intervals.
- Record your findings to a table of results.
RESULTS:
My preliminary results have shown that ‘as the length of a wire increases the resistance also increases.
I have used the ammeter ranging from 0 – 1A as it is more accurate (reads in interval of 0.05A) but have lowered the voltage on the power pack/supply so all results range between 0 – 1A. Linked to this, I have also found that if the voltage is too high on the power pack/supply, the reading on the voltmeter will go off the scale and will be unreadable thus the reason why the voltage should be/was lowered. However, an ammeter ranging from 0 – 2A could be used instead; this though is not as accurate as the 0 – 1A ammeter as its scale ranges in intervals of 0.2A. Lowering the voltage on the power pack does/may not affect the resistance when worked out using the formula Resistance (R) = Voltage (V) / Current (I), as shown on the preliminary results produced.
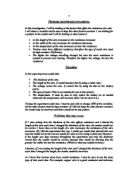
PREDICTION:
I predict that as the length of a wire increases the resistance also increases in proportional to the length. This is because there would be an increase in atoms, as well as electrons having to make their way further up the wire to the positive end which in return creates a greater chance of electrons colliding with the atoms and therefore meaning more resistance. To this point doubling the length would mean an increase in the number of atoms which would result in twice as many collisions, which would in turn slow down the flow of electrons and increase the resistance. Halving the length would mean the opposite, half the atoms, half the collisions and therefore a decrease in resistance. From this, I predict my graph to look something like this after plotting my results:
OBTAINING EVIDENCE:
RESULTS TABLE TO SHOW TO THE VOLTAGE, CURRENT & RESISTANCE AS THE LENGTH INCREASES
KEY
W – Width of Wire (mm) * Repeated – Was 0.88A before repeating anomalous
P – Power in volts (v) result & 0.66A after repeating the experiment at
L – Length (cm) 10cm for experiment 3.
I – Current in amps (A)
V – Voltage (v)
R – Resistance (Ω)
AVR – Average Resistance (Ω)
All the readings made were taken at 10cm interval across the 2m length of constantan wire, and I have recorded all my outcomes from the experiment in the results table above. I have labelled the table with the correct units/ produced a key. Using this data I have produced a graph showing the relationship between the average resistance and the length of the wire.
I have used the apparatus appropriately and safely in order to produce reliable results as well as following a structured reliable method to help produce these results and to make sure the experiment goes according to plan.
To get accurate and reliable results the experiment was repeated twice more to see if any of the results on the previous experiments contained anomalous, unreliable outcomes. For example the second experiment contain an anomalous results (as shown on table) which differed completely compare to the outcomes of experiments one and three. To be able to plot the graph and compare the resistance against the length of the constantan wire the average resistance was calculated. This data in turn was transferred to produce the graph.
When analysing the graph I would be able to see if there are any outstanding anomalous results/outcomes and if so I could/can use scientific explanations/reasoning on why they occurred.
ANALYSIS:
From the graph, I can see that the resistance of the wire is just about proportional to the length of the wire. The graph shows a strong positive correlation and the ‘line of best fit’, is a straight line passing near enough in the region on the origin, showing that as the length of a wire increases the resistance also increases in proportional to the length and therefore agrees with/acknowledges my prediction to be correct. The graph also shows that each time the length is increased by 10cm the resistance increase approximately by 0.5Ω.
From the range of results I have, I am able to see that as the resistance increases, the current decreases and the voltage increases, which is because a higher voltage is required to send a smaller current through the length of the wire, because the resistance has increased and is opposing the flow of electrons through the wire. The resistance of a wire depends on the number of collisions the electrons have with the atoms of the material in this case Constantan Wire. If there are a greater number of atoms there will be a greater number of collisions, which will therefore increase the resistance of the wire.
The results support my prediction that, ‘as the length increases then the resistance will also increase in proportional to the length.’
The man behind resistance was George Ohm and the law that he discovered, saying that the resistance of a component depended on the dimensions and other factors that surrounded the wire, if these factors were not all equal then the resistance of the wire would change. No matter what the voltage is of the circuit, the resistance will remain the same, or will be in the same region. Again, this can be explained by Ohms Law: using the formula R= V/I, where there is 2X the current, and the voltage is the same, therefore R will be halved.
The results from the graph give a clear indication of how the resistance compares to the wire length. In any given metal wire, there are a number of atoms and free moving electrons. Electricity is the movement of these electrons through the wire. Resistance is caused when the free electrons moving through the wire collide with the atoms making their path through the wire more difficult. This means that if there are more atoms in the way to collide with the free electrons the resistance is increased. In a length of wire there will be a number of atoms, and in a wire twice the length, there will be twice the number of atoms. In turn this will lead to there being double the number of collisions between the electrons and the atoms increasing the resistance by 2. This explains why the results were directly proportional. For example a wire that was 10 cm long may have 500 atoms blocking the electrons. Therefore in a wire 20 cm long, there would be 1000 atoms meaning that the resistance had doubled.
The line of best fit clearly shows that the results followed the expected pattern very well. The points are very close if not touching the line. This shows how the results were directly proportional through out, as the gradient remained the same.
The equation for resistivity is:
WHERE…….
R = resistance of some conductor,
L = length of the conductor,
A = area of cross-section/thickness of the conductor,
p = the resistivity of the material of which the conductor is made (different
materials have different resistance).
This equation tells us two things. Its shows us that Resistance is directly proportional to Length, giving evidence that the resistance increases, when the length increases. It also shows that the Resistance is inversely proportional to the area of the wire, or the cross section, telling us that when the area of the wire cross-section area increases, the resistance decreases.
EVALUATION:
After having done the experiment, I have recorded the results and drawn a graph with a line of best fit, in which I have noticed an anomalous result at 60cm where the average resistance is 2.43. There are reasons why I may have got this anomalous result which is because; the voltage or current may have been misread or the crocodile clip may have not been placed exactly on 60cm on the constantan wire.
Accuracy:
On the whole I think my outcomes of the experiment were accurate and reliable. I have used all the correct apparatus/equipment required to carry out the experiment. Equipment such as a micrometer was used to measure the thickness of the constantan wire and at each of the five points: 0cm, 50cm, 100cm, 150cm and 200cm the thickness measured 0.37 of a millimetre. There were two types of ammeters, one ranging from 0 – 1A and the other 0 – 2A. The 0 – 1A ammeter was more accurate as it measured in interval of 0.05A whereas the ammeter ranging form 0 – 2A measured in intervals of 0.2A. 0 – 2A ammeter can be used when the reading go off the scale on the 0 – 1A ammeter, however for the experiment I carried out, I used the 0 – 1A ammeter and instead lowered the voltage on the power pack/supply which would lower the voltage and make it readable on the ammeter. This though does not affect the resistance when worked out. The wire had been taught so it was as straight as possible, but was not over done in case it was over stretched and became thinner. The wire was checked to see that there weren’t any kinks in the wires as this would have increased the thickness of the wire.
Reliability:
The outcomes/results of the experiment were reliable. To ensure I produced accurate and reliable results I took forward a few procedures and looked at the equipment / apparatus being used to conduct the experiment. I used Constantan Wire (Black, 28swg) as Nichrome Wire was affected by heat/temperature, whereas Constantan Wire may be slightly affected by temperature but would still provide you with better results. Another instrument used was the micrometer to measure the thickness of the wire. This was done as different wires may have different thickness. Also the thickness of a wire may be different at one point than another along the wire which is why the micrometer was used to measure the thickness was measured at certain points (0cm, 50cm, 100cm, 150cm & 200cm). From the results shown one or two had to be repeated as it did not fit in with the pattern which may be because of errors in reading the scale or applying the crocodile clips at the wrong point of measurement.
Errors:
Certain error during the experiment may/can affect the results. Aspects such as the thickness can affect the results if the thickness of the wire was not constant. If at some points the thickness of the wire was greater, more electrons can travel through the wire at the same time which means a decrease in resistance. If there were kinks in the wire this could increase the thickness or if the wire was thick in the first place and it was taught too much for it to become thinner could cause this error. The number of insulated circuit wires also could cause an error. Each circuit wire has its own resistance which in turn as a result would affect the resistance of the constantan wire. The crocodile clips tip covers a larger area on the constantan wire, so instead of showing the current and voltage of say 50cm it shows the current and voltage of the area ranging from approximately 49.9cm to 50.1cm, which could also affect the resistance and therefore be another error to consider.
Parallax Error:
A parallax error occurs when the eye is not placed directly opposite the scale when a reading is being taken. A parallax error has as I think shown up in the results (shown on the results table), where I have misread or taken down the wrong voltage when reading off the scale.
Limitations:
Then only limitations are that we do not what happens between each of the 10cm intervals and what happens beyond 200cm length of wire, so we could me missing out on valuable information or data.
Improvements:
Although my results were reliable and accurate enough there are improvements which could be made. Improvements such as:
- Instead of using standard ammeters and voltmeters, digital one could be used as these are much more accurate in providing precise readings. These can also be set to an ohm meter, which therefore would measure the resistance directly.
- As said early the insulated circuit wires have a resistance, which would affect the resistance of the constantan wire when outcomes are taken down at each of the 10cm intervals. So therefore it is best to keep the number of circuit wire to the minimum.
- Crocodile clips have tips which cover a larger surface than required for the experiment, which would result in the resistance of a greater area being shown (e.g. 49.9cm to 50.1cm) rather than the resistance of the point required (e.g. 50cm). So therefore as an improvement crocodile clips with a pointed tip would provide you with better and more accurate results as they would only give the resistance of the point required and not the area around it.
- As another improvement, when measuring the current and voltage at 10cm intervals to find the resistance, we do not know what would/could happen in between or how much the resistance goes up by each time. So therefore it might be an improvement to measure the current and voltage at 2cm intervals or even every 1cm. We do not also know what happens after 200cm so it could be an improvement to measure several more points beyond 200cm.
FURTHER WORK:
For further work I will be using the equation:
With this we could do an experiment to find out the resistivity, using this to calculate the resistance, making the results more accurate, and also allowing us to prove that the area is inversely proportional to the area.
The Resistivity/Ωm of the material constantan is: - 49 x 10-8 at room temperature. So placing this in the formula/equation would enable you to find the resistance of the wire.
So……
* Length must be converted into meters (m)
e.g.
Using the same formula or equation I have worked out the resistance of the other lengths and have placed this on a table shown on the following page which I will be comparing using the results calculated using the formula/equation:- Resistance (R) = Voltage (V) / Current (I), which are also shown on the table in red.
Comparing the two sets of Resistances (the resistance and average resistance), you can see that the resistance at each of the length intervals differ whether it’s a big difference or small. This in turn shows that the equation for resistivity produces more accurate and reliable results, which is because there is no need to calculate the average resistance but instead feed the lengths and area of cross- section into the equation and calculates the resistance as an whole, precisely and accurately.
The graph below shows my prediction of how a graph showing that current (I) is proportional to voltage (V) would look like.
To calculate the gradient of the graph showing Current (I) is proportional to voltage (v) the formula/equation above should be used in further experiments and in order to do this the average current and voltage need to be calculated. Producing the graph and calculating the gradient will in turn determine if my prediction to what the graph would look like is correct. This could be taken forward and shown in further/future experiments.