Diagram-
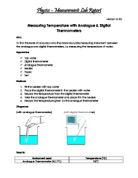
Diagrams Showing setup of the Cork Bung Experiment-
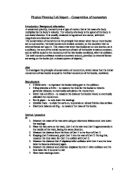
Diagram showing the setup of the pins experiment-
Method-
Cork Bung Experiment
- The displacement can was filled to the spout
- The cork bung was tied to the sinker and placed in the displacement can
- The water displaced water was collected in the 250ml beaker and then transferred to the 100ml measuring cylinder
- The reading was recorded
- Steps 1-4 was repeated using the sinker alone
- The cork bung was placed on the triple beam balance
- The closest weight was moved until the triple beam balance was leveled to the 0 mark
- The reading was recorded
Drawing Pins Experiment
- The displacement can was filled to the spout
- 10 pins was placed in the displacement can
- The water displaced was collected in the 250ml beaker and then transferred to the 10ml measuring cylinder
- The reading was recorded
- 10 pins was placed on the triple beam balance
- The closest weight was moved until the triple beam balance was leveled to the 0 mark
- The reading was recorded
Results-
Cork Bung Experiment-
- mass of cork bung- 1.4g
-
volume of cork bung and sinker-23cm3
-
volume of sinker- 15cm3
Drawing Pins Experiment-
- mass of 10pins- 4.8g
-
volume of 10 pins- 1.3cm3
Calculations-
Cork Bung Experiment
Volume of cork bung- 23-15=8cm3
= 8cm3 x .000001
= .000008m3
Mass- 1.4/1000
= .0014
Density- mass/volume
= .0014/.000008
= 175kgm-3
Relative density- 175/995.6502
= 0.1757645405986962
Drawing Pins Experiment-
Mass of 1 pin – 4.8/10
=0.48g-0.48/1000
=0.00048kg
Volume of 1 pin- 1.3/10=0.13cm3
= 0.13/1000000
=0.00000013
Density-mass/volume
=0.00048/.00000013
=3692.307692307692kgm-3
Relative density= 3692.307692307692/995.6502
=3.708438658785678
Observations-It was observed that the cork bung floated because its relative density was less than the density of water and the drawing pins sunk as its relative density was greater than the density of water.
Precaution-
- Triple beam balance was zeroed.
- The water level in the displacement can was kept constant right under the spout.
- Fans were taken off and windows were closed to avoid any disruptions in the reading of the triple beam balance.
Sources of error- The cork bung was too light to stay in the middle of the tray in the triple beam balance, therefore it was hard to get an accurate reading of its mass. The displacement can was placed on an unleveled surface causing the level of water to be less than it was supposed to be for an accurate reading.
As the pins were round they rolled around in the triple beam balance making it hard to get the triple beam balance leveled. The measuring cylinder was not on a level surface when reading causing the meniscus to be tilted causing a parallax error while taking readings.
Discussion-This lab was fairly challenging but it was completed with satisfying results. This experiment with the cork bung can’t be improved and no trends were noticed when looking and the results taken. The experiment with the drawing pins could be improved by using a greater amount of pins when doing the experiment to find a more accurate reading by finding the average of more pins.
Conclusion-Within the limits of experimental error the relative density of a cork bung was found to be 0.1758 and the relative density of a drawing pin was found to be 3.7084.