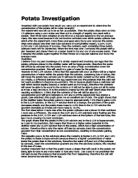
Apparatus list
One potato
One set of cork borers
Three test tubes
A cutting board
A scalpel
Distilled water
Sucrose solution
A balance to measure mass
Method
1. We took three specimens in tubes
2. In the first tube we added 10ml of distilled water (0M)
3. In the second tube we added 10ml of sucrose solution (0.5M)
4. In the third tube we added 10ml of sucrose solution (1M)
5. We took a cork borer and pushed it through a potato three times to make three potato chunks.
6. We cut the ends off and made them all the same size using a ruler and measuring 2cm each time.
7. We then weighed each individual potato chunk and recorded the results
8. We then put 1 potato chunk in each specimen tube
9. We then left them for 2 days.
10. We then took each potato chunk out and dabbed then on paper to remove excess liquid.
11. We then weighed each potato chunk and worked out the percentage difference in mass.
Results
Conclusion
From my results I conclude as the concentration of sucrose solution increases the mass decreases.
Prediction
I predict when the concentration changes, the mass will also change. When the solute outside the potato is higher than the concentration inside the potato, the overall mass of the potato chunk will decrease. When the solute outside the potato is lower than the concentration inside the potato chunk, the mass of the potato will increase. However, if the concentration of the water is the same inside and out of the potato chunk then the mass will stay the same.
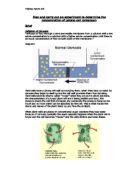
I predict the potato chunk will lose the most water when there is a higher concentration of sucrose solution and I also predict the potato will gain more water when there is a lower concentration of sucrose solution. The diagram below helps to explain this:
When the two solutions are divided by a semi permeable membrane the water moves from the area of high concentration to an area of low concentration until both sides are equal.
I predict in above 0.2M of solution there will be a higher concentration than the water it is in so the mass will decrease because water moves out of the potato. I also predict that in 0.2M of solution there will be a lower concentration in the potato than in the water so the mass will increase. I also predict the isotonic point will be around 0.5M as it shows in my graph below which I have made from my preliminary results.
We can see in my sketch graph which I made below that above the x axis of the graph the cell is turgid and the cell is most turgid at 0M. This is because it acts as a hypotonic solution because since the sucrose solution has a higher concentration, this means it has lower water potential as there are a larger number of solute molecules and so there is less number of freely moving water molecules, as they form clusters around the solute. On the other hand, the water in the potato cell has a higher water potential because it has a weaker concentration, which means there are less solute molecules and thus, more freely moving water molecules. As a result, the water in the potato cell acts as the hypotonic solution.
We can also see in my sketch graph below that below the x axis of the graph the call is Flaccid and the cell is most flaccid and 1M. This is because it acts as a hypertonic solution this is because when the potato chip is immersed in a sucrose solution of higher concentration, in this case 1M of sucrose solution, there is a greater difference in the concentration between the water in the potato cell and its external solution so that is a greater concentration gradient. Since the water in the potato cell is of the same concentration and its external solution it becomes more concentrated, as the external solution has a greater number of solute molecules and so less water potential. In other words, more water molecules are required to move out of the potato cells to the external solution. Since more water leaves the cells, the potato chips decrease more in mass.
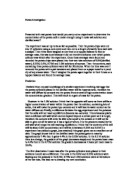
Method
Apparatus
One potato
One set of cork borers
Twelve test tubes
A cutting board
A scalpel
Distilled water
Sucrose solution
A balance to measure mass
Modifications: I will be using twelve specimens this time instead of just three, and I will also have three specimens for each molar we test. I will also use a sieve and tweezers to help me pick the potatoes out which will make it easier.
Method
1. We will take twelve specimens in tubes.
2. In the first tube we will add 10ml of sucrose solution. (0.2M)
3. In the second tube we will add 10ml of sucrose solution. (0.2M)
4. In the third tube we will add 10ml of sucrose solution. (0.2M)
5. In the third tube we will add 10ml of sucrose solution. (0.4M)
6. In the third tube we added 10ml of sucrose solution. (0.4M)
7. In the third tube we will add 10ml of sucrose solution. (0.4M)
8. In the third tube we will add 10ml of sucrose solution. (0.6M)
9. In the third tube we will add 10ml of sucrose solution. (0.6M)
10. In the third tube we will add 10ml of sucrose solution. (0.6M)
11. In the third tube we will add 10ml of sucrose solution. (0.8M)
12. In the third tube we will add 10ml of sucrose solution. (0.8M)
13. In the third tube we will add 10ml of sucrose solution. (0.8M)
14. We will take a cork borer and push it through a potato twelve times to make twelve potato chunks.
15. We will cut the ends off all the potato cylinders and made them all the same size using a ruler and measuring 2cm each time.
16. We will then weigh each individual potato chunk and record the mass.
17. We will then put 1 potato chunk in each specimen tube.
18. We will then leave them for 2 days.
19. We will then take each potato chunk out with tweezers and a sieve and dab then on paper to remove excess liquid.
20. We will then weigh each potato chunk again and record the results.
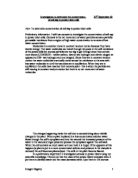
Using a cork borer
Results
Before
After
Conclusion
I conclude that as the concentration of sucrose solution increases the mass of the potato decreases, I also conclude the isotonic point is around 3M.
My graph shows above my x axis the potato is turgid, this is because there is a high concentration of water where as the potato has a low concentration of water, osmosis is the movement of water from a high concentration to a low concentration so the potato sucks up a lot of the water. This relies on the fact of osmosis; if a cell is placed in a less concentrated solution, then in order for equalization to occur, that is for the concentration to be equal on both sides, then water must move into the cell so that its water becomes diluted and so that the concentration gradient is eliminated. In this case, since the potato cells inside the chip obviously have cell sap, a mixture of salts and sugars with water, it forms a weak solution. Even though it is weak, it is still more concentrated than the distilled water. Thus, in order for equalization to occur, some of the distilled water must move across the cell membrane of the potato cell and enter it. In this case, the cells will become bloated or turgid; they become firm and full. Due to this, the potato chip will increase in mass as the potato cells have become firm and turgid; they occupy more space and so the chip increases in mass.
My graph shows on the x axis there was the same amount of water in the potato and the solution it was in. in other words it reached its isotonic point. This means osmosis did not occur. My graph also shows below the x axis the potato became flaccid, this is because there is a higher concentration of water in the potato than in the tube. So the water moved through the potatoes semi permeable membrane to the container.
I predicted all of the above in my prediction. In my prediction I predicted as the concentration changes, the mass will also change. I also predicted when there is a higher concentration outside the potato then the concentration inside the potato will increase. So, this means if there is a lower concentration outside the potato then the concentration inside the potato will decrease. My sketch graph in my preliminary had a different result to my official results, but that is probably because I had no repeats. Although saying that, the principal was the same, the mass increased when the concentration of sucrose solution was 0 M. As the concentration o sucrose solution increased, the mass of the potato gradually decreased.
Evaluation
From my experiment I found out the concentration of a potato cell cytoplasm. I used a good range of sucrose solutions (0M, 0.2M, 0.4M, 0.6M, 0.8M) and each with three repeats, this made It a fair test which gave accurate results and my overall results and method were very good. Overall my results were of a good quality because I have no anomalies. Although I have good results, I did make some errors.
Errors
Length of potato chip – My ruler that I used may not have been accurate or I may have not accurately measured it because it was very difficult to get the measurement to the exact millimetre because the chip was a funny shape and it was awkward.
Volume of Solution – This may have not been exactly the right measurement because it was difficult to measure out the solution and I tried to do it quickly towards the end because I was running out of time. This may have provoked an error. I also used different volume cylinders which may have given me faulty results.
Time in Solution – Not all potato chunks has the same amount of time in its solution, this is because as we did the first measurement we put the first potato chip in with it and then went on to the next so this means one potato chip may have had up to 15 more minutes in the solution than the last potato.
Top pan balance – When I first weighed the potatoes I used a different top pan balance than when I took the potatoes out and re-weighed them. This left room for error because each top pan balance is slightly different so it might have given me 0.01g difference in results.
Improvements
Length of potato – I could use a special potato cutter, or alternatively I could use callipers to help me get an accurate result.
Volume of solution – I could use the same cylinder volume or I could get down to the level of the cylinder and make sure its at the same meniscus.
Time of solution – I could get a machine to make sure each potato is submerged in its solution for the same amount of time. Or I could get twelve different people to put each potato in its solution as the same specific time.
Top pan balance – I could make absolute sure that I use the same top pan balance throughout.
Analysing Evidence
I could say that I do not have enough evidence to support my conclusion fully although I do not have any anomalies. This is because when I look at my results, I could do with a wider range of results. Looking at my graph, it looks reasonably smooth; there are a few points where the line goes off course but not so much as to call them anomalies. To give myself sufficient evidence to support my conclusion I could have a larger range of solutions, for instance (0M, 0.2M, 0.4M, 0.6M, 0.8M, 1M, 1.2M, 1.4M, 1.6M, 1.8M, 2.0M.) and have at least 5 repeats for each measurement. So, because I have no anomalies I have suitable results and data at the moment but I cannot be 100% sure because I need more repeats and a larger range of solutions.
Further Work
If I wish to do the experiment again, to improve the method and results and to give more evidence to support my conclusion and my theory for osmosis, I could try the same experiment with a range of different types of potatoes to if I get similar results, types of potatoes such as:
-Kind Edwards
-Russet Potato
-New Potato
-White round potato
-Yukon gold potato
I could try using different fruits and vegetables, to see if the osmotic theory is similar with them, I could use Fruit and vegetables such as:
-Carrots
-Cucumber
-Bananas
-Apples
I could also try different types of solutions to see if the osmotic theory only works with the sucrose solution and to see if osmosis works better with these solutions.
-Salt
-Orange Juice
-Lemonade
-Coca Cola
When doing this, I would incorporate more repeats, at least five for each reading. I will use a larger range of solutions, being 0M, 0.2M, 0.4M, 0.6M, 0.8M, 1M, 1.2M, 1.4M, 1.6M, 1.8M, 2.0M.
1. I will take 220, 2cm specimens of carrot and put them in 55 individual test tubes without solution for the moment.
2. I will take 220, 2cm specimens of Banana and put them in 55 individual test tubes without solution for the moment.
3. I will take 220, 2cm specimens of cucumber and put them in 55 individual test tubes without solution for the moment.
4. I will take 220, 2cm specimens of apple and put them in 55 individual test tubes without solution for the moment.
5. I will divide the 220 different specimens of carrot into 4, so I will get 55 in each group. I will then put 5 specimens in for each reading (readings are: 0M, 0.2M, 0.4M, 0.6M, 0.8M, 1M, 1.2M, 1.4M, 1.6M, 1.8M, 2.0M.)
6. I will measure out 10ml 5 times of coca cola solution for each reading.
7. Using the second lot of 55 specimens, I will then put 5 specimens in for the next lot (readings are: 0M, 0.2M, 0.4M, 0.6M, 0.8M, 1M, 1.2M, 1.4M, 1.6M, 1.8M, 2.0M.)
8. 6. I will measure out 10ml 5 times of lemonade solution for each reading.
9. Using the third lot of 55 specimens, I will then put 5 specimens in for the next lot (readings are: 0M, 0.2M, 0.4M, 0.6M, 0.8M, 1M, 1.2M, 1.4M, 1.6M, 1.8M, 2.0M.)
10. 6. I will measure out 10ml 5 times of orange juice solution for each reading.
5. I will divide the 220 different specimens of Banana into 4, so I will get 55 in each group. I will then put 5 specimens in for each reading (readings are: 0M, 0.2M, 0.4M, 0.6M, 0.8M, 1M, 1.2M, 1.4M, 1.6M, 1.8M, 2.0M.)
6. I will measure out 10ml 5 times of coca cola solution for each reading.
7. Using the second lot of 55 specimens, I will then put 5 specimens in for the next lot (readings are: 0M, 0.2M, 0.4M, 0.6M, 0.8M, 1M, 1.2M, 1.4M, 1.6M, 1.8M, 2.0M.)
8. 6. I will measure out 10ml 5 times of lemonade solution for each reading.
9. Using the third lot of 55 specimens, I will then put 5 specimens in for the next lot (readings are: 0M, 0.2M, 0.4M, 0.6M, 0.8M, 1M, 1.2M, 1.4M, 1.6M, 1.8M, 2.0M.)
10. 6. I will measure out 10ml 5 times of orange juice solution for each reading.
11. I will divide the 220 different specimens of cucumber into 4, so I will get 55 in each group. I will then put 5 specimens in for each reading (readings are: 0M, 0.2M, 0.4M, 0.6M, 0.8M, 1M, 1.2M, 1.4M, 1.6M, 1.8M, 2.0M.)
12. I will measure out 10ml 5 times of coca cola solution for each reading.
13. Using the second lot of 55 specimens, I will then put 5 specimens in for the next lot (readings are: 0M, 0.2M, 0.4M, 0.6M, 0.8M, 1M, 1.2M, 1.4M, 1.6M, 1.8M, 2.0M.)
14. 6. I will measure out 10ml 5 times of lemonade solution for each reading.
15. Using the third lot of 55 specimens, I will then put 5 specimens in for the next lot (readings are: 0M, 0.2M, 0.4M, 0.6M, 0.8M, 1M, 1.2M, 1.4M, 1.6M, 1.8M, 2.0M.)
16. 6. I will measure out 10ml 5 times of orange juice solution for each reading.
17. I will divide the 220 different specimens of apple into 4, so I will get 55 in each group. I will then put 5 specimens in for each reading (readings are: 0M, 0.2M, 0.4M, 0.6M, 0.8M, 1M, 1.2M, 1.4M, 1.6M, 1.8M, 2.0M.)
18. I will measure out 10ml 5 times of coca cola solution for each reading.
19. Using the second lot of 55 specimens, I will then put 5 specimens in for the next lot (readings are: 0M, 0.2M, 0.4M, 0.6M, 0.8M, 1M, 1.2M, 1.4M, 1.6M, 1.8M, 2.0M.)
20. 6. I will measure out 10ml 5 times of lemonade solution for each reading.
21. Using the third lot of 55 specimens, I will then put 5 specimens in for the next lot (readings are: 0M, 0.2M, 0.4M, 0.6M, 0.8M, 1M, 1.2M, 1.4M, 1.6M, 1.8M, 2.0M.)
22. I will measure out 10ml 5 times of orange juice solution for each reading.
23. Before putting the chips into the solution I will weigh them all.
24. After all the following, I will get 880 people to put the right chip in its solution at the same time.
25. I will leave the chips for two days
26. I will then get the 880 people to take the chips out at the same time and then re-weigh them on the same top pan balance and record the results.
Bibliography
Biology textbook – Jones & Jones
CGP Biology revision and practice text book