I think the solution of distilled water will cause the maximum increase in mass because water will enter the cells by osmosis, as this is the solution with a complete water concentration. However, there will be a point where the concentrations of water inside and outside the potato cells are equal (isotonic). At this point there will be no change in the mass of the potato, as the net movement of water will be zero - no osmosis has occurred.
Safety:
Although this experiment is reasonable safe, remember to take care when using the knife to cut the potato and try not to spill any of the sucrose solutions onto your clothes. The solutions being used in this experiment are not harmful but may stain your clothes, so always wear an overall. When carrying out the experiment be careful with any glass equipment and safety goggles should also been worn, just as a precaution to stop anything coming into contact with the eyes.
Fair Test:
To create a fair test certain aspects of the experiment will have to remain constant whilst one key variable is changed. I have chosen to vary the concentration of the sugar solution to provide a varied set of results. The mass of the potato is a dependent variable, and this means that it will be measured (in grams) throughout the experiment.
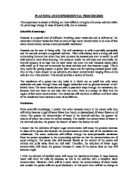
Table to show how the concentrations were mixed:
Apparatus:
Method:
Preliminary Work:
From the preliminary work it was decided that glass dishes would be used instead of test-tubes, to ensure enough room for the cells to become as turgid as possible. Also discovered, was that the results became more varied the longer the potato discs in each solution. However, due to a limited investigation time, each experiment was allowed ten minutes, as this was enough time for osmosis to take place and provide good results. Another point was that the volume of solution needed to cover the entire surface area of the potato disc, to allow as much absorption as possible. The preliminary work proved that the concentrations, time the potatoes were left for and percentage change measurements were appropriate, and reasonable results could be obtained.
OBTAINING EVIDENCE
Table of Results:
The effect of six different values of a particular variable will be investigated, and repeated to provide accurate and reliable results.
From these results we can see that the more water in the solution, in ratio to the sugar, the greater the increase in weight of the potato - caused by osmosis. When there is more sugar, in ratio to the water, a decrease in mass occurs. This is because the water that is already present in the potato is passed through to the solution - plasmolysis (the reverse action to osmosis.)
ANALYSING EVIDENCE AND DRAWING CONCLUSIONS
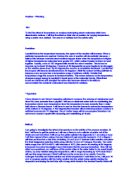
This graph displays how the molar concentration of each solution affects the percentage change in mass. The last two points along the graph have little distance between them showing that there was only a small percent of mass change.
The point of 0.20M gains approximately 4.90% in weight. This shows that the water potential of the sucrose solution in the dish is stronger than that of the potato disc. The next point, 0.40M, gains approximately 2.94% in mass, showing that the sucrose solution has an even weaker water potential than the 0.20M solution. This also proves that osmosis took place. This pattern carries on through the graph, until the concentration reaches above 0.80M, where there is no indication that the cell is increasing or decreasing further in size, suggesting that the cell is fully plasmolysed.
Even though these results support the original prediction, the graph used only shows the mass change in percentage and not in grams which is more exact. This means that the 0.6M solution is illustrated to have no change in mass, yet the table of results (g) shows a clear match with the initial theory. This is the point of 0.60M is where the potato is neither increasing nor decreasing in mass - the isotonic point. No osmosis is taking place as both the potato and the solution have an identical molar concentration. This data can be used to estimate the concentration inside the potato cell as 0.6M, supporting the original prediction. However, it is important to realize that this is only an estimate as the potato cells will not be uniform in their concentration. The strongest Molar solution caused the greatest decrease in mass due to the water molecules from the weaker solution inside the potato cell, in the cytoplasm, diffusing into the stronger solution, with a low water concentration.
The original prediction was that “the solution of high concentration will cause the greatest decrease in mass and that the distilled water will cause the maximum increase in mass.” The prediction is supported by scientific evidence and the results from this investigation which show that the distilled water did increase in mass by 07.84%. The strongest solution of 01.00M did also match the prediction as it had the greatest decrease in mass by -01.96%. This shows that the solutions in between these two extremes should match the original prediction and after looking at the graph it is clear that they do.
The graph gives the line of best fit over the course of the ten minute experiment. This illustrates that the percentage gain and loss in inversely proportional to the concentration. There is still a pattern on the graph: As the concentration of the molar solution increases, the percentage change in mass decreases. The gradient is not constant along the graph; the steepness decreases as the X axis gets bigger. This is because the potato chip is becoming as flaccid as possible, and therefore the change in mass of each molar concentration is becoming closer and closer together.
EVALUATING EVIDENCE
Although the original plan did not work particularly well, the results that were recorded were good. There were no obvious anomalous results in the experiment; however the line of best fit does show that the results may not have been totally accurate, as the first two and last three points do not fit the pattern of this line. The data gained appears accurate and sufficient enough to conclude the experiment, and prove the hypothesis.
The results that were obtained clearly show that there is a difference in the process which takes place within the potato when placed in different concentrations of sucrose solution. The consistency in the results suggests that the apparatus selected for this experiment was appropriate. The graph illustrates that the potato cell increases in mass with solutions of a high water concentration and decrease in mass with solutions of a low water concentration.
The method used for this investigation was quite difficult to carry out, for example, to record accurate results, all measurements of mass and concentration must be exact. In order to improve on any further work that could be carried out . . . .
- The accuracy of the investigation was adequate, however the concentrations were measured using a measuring cylinder and could be made more accurate using titration.
- When the potato was dried to remove surface liquid it was not necessarily the same on each potato. A more accurate and consistent method of drying would improve the accuracy further.
- The potato discs were from two different potatoes as they were both very small. This means that the potato discs may have varied in their amounts of surface water, which would have affected the overall mass change.
- This also means that the potato discs may have had different strengths of cell sap inside them, so the concentration of solutions surrounding them would not have the same effect on each disc.
- The experiment could be extended over a period of 24 hours to provide a more dramatic graph, because the osmosis action would reach its maximum capability, and therefore show how much water could be transferred for each solution.
- Including concentrations such as 00.10M and 00.30M would increase accuracy and improve the graph.
- The number of people carrying out the experiment could be increased to three people in the group, so that each task could be assigned to a different person.
- Repeating the experiment more times would not have been very useful, as the results that were obtained after two experiments were only 00.01g apart from each other, so it is clear that the results were accurate and reliable.
- Other investigations could include using different varieties of potato or different plant tissues e.g. carrot. This would show that it depends on the sugar content of the actual species being investigated, as to the point of equilibrium between the species and its surrounding sucrose solution.
- Another investigation to prove that osmosis affects the percentage change in mass of potato cells due to different strengths of surrounding solutions, would be to carry out a flexibility test to measure how stiff the potato becomes when the surrounding solution is weaker than the concentration of the potato. Due to the water molecules passing from the surrounding solution into the potato cells, through osmosis, the cells would become turgid and therefore prevent movement. This investigation should show similar results to the actual investigation - just by a different means, which would make the conclusion more reliable.
This investigation alone is not sufficient enough evidence to firmly support the conclusion. Although the results are reliable and accurate, this investigation only uses one method of showing that osmosis takes place, through measuring the percentage change in mass before and after osmosis has taken place. In order to state the conclusion and be sure that it is completely accurate and reliable, other investigations would have to be carried out; such as the one mentioned above, which measures the extent of turgidity and flaccidity of the potato disc. Only once more investigations have been carried out, and if the same results for each experiment are obtained, can the conclusion be correct and reliable as it is backed up by scientific evidence from more than one source.