The potato cells will have decreased in length, volume and mass. The greater the concentration of water in the external solution the greater the amount of water that enters the cell by osmosis. The smaller the concentration of water in the external solution the greater the amount of water that leaves the cell.
However, I think, there will be a point where the concentrations of water inside and outside the potato cells are equal (isotonic). At this point there will be no change in the length, volume and mass of the potato, as the net movement of water will be zero, no osmosis has occurred.
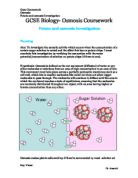
I think that the reason for this prediction is that when the sucrose concentration is low, the concentration of water outside the cells of the potato chips will be greater than that inside, and therefore water will osmose into the cells of the chip which will gain mass. But as the concentration of the sucrose increases, the concentration of water outside the cell will eventually become less than inside the cells of the chip, and thus the water will osmose out of the chip and mass will decrease.
Below is a diagram to show how much water osmoses across the partially permeable membranes of the chips, and in which direction in both high concentrations of sucrose solutions and low concentrations of sucrose solutions.
Fair Test
To create a fair test certain aspects of the experiment will have to be kept the same whilst one key variable is changed. I have chosen to vary the concentration of the sugar solution. This will give me a varied set of results from which I hope to make a decent conclusion. If any of the non-variables below were not kept constant it would mean it would not be a fair test. For instance if one of the potato chips was 1cm longer the surface area of the chip would be larger and there would therefore be more space for osmosis to occur. Doing all the tests at one temperature will control the temperature.
The factors that I will keep the same are:
All the experiments will be done at room temperature as this ensures that all of the potato chips will have a consistency and will not affect the experiment.
The same type of potato will be used, which have been treated in the same way, e.g. have all been cut without being washed and will all be peeled this also ensures the consistency of the potato.
I will measure the mass in grams. The potato chips length and volume will be measured before it is put in the solution, and after. This will allow me to see whether osmosis has taken place, and to what extent. I can also see whether the density has changed or not.
The volumes of the solution that the potato chips are kept in must be the same. They must be totally covered in the solution so that all parts of the potato are in the same conditions.
I am also going to use the same balance to weigh my potato chips. This is because the measurements may vary slightly between scales.
Apparatus
Potato
Six concentrations of sucrose solutions (0.0M, 0.2M, 0.4M 0.6M, 0.8M, 1.0M)
Water (for part solution)
Electronic Balance
Measuring Cylinder
Core Borer
Beaker
Petri Dish x6
Scalpel
Coloured Markers
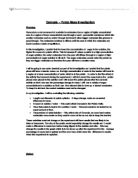
Explanation
A range of sucrose sugar solutions will be prepared with concentrations 0 molar, 0.2 molar, 0.4 molar, 0.6 molar, 0.8 molar and 1 molar. This will be done by adding varying amounts of distilled water to varying amounts of sucrose solution. Sections of potato will be cut using a scalpel/core borer and will be measured using a ruler. This part of the preparation must be done very accurately as a change in the surface area may allow more or less osmosis to occur. The mass of each chip will be measured as well so that more results can be obtained. Three chips will be placed in each test tube each time so that I can take an average for each tube. I will use 10ml of each concentration of sugar solution and once in the test tubes they each will be labeled. The potato pieces will then be placed in the different test tubes and then left for 48 hours. Then the potato pieces will be removed, the surface solution removed using paper towels and then they will be re-weighed.
Method
1. Mix the sugar solutions to the correct concentrations e.g 0.0m, 0.2m etc.
2. Using a cork borer cut cylinders out of the potato
3. Using a scalpel and ruler cut the cylinders down to roughly the same size. You should then have 18 chips. (3 for each dish)
4. Take six Petri dishes and then label them 0 molar, 0.2 molar, 0.4 molar, 0.8 molar and 1 molar.
5. Using a pipette put the same amount of each different concentration of solution in each dish.
6. Then weigh every potato chip on an electronic balance and record the weights in a table. Colour each set of the three potatoes in three different colours.
7. Place 3 potato chips into each Petri dish and place the rack in a controlled environment.
(3 chips were used to create an average, which gave me a better set of results and more accurate graphs.)
8. After 48 hours drain out the solutions in the sink and placed all the chips on a paper towel in order not for any confusion.
9. Dry each chip with a paper towel and then place each one, one by one, on the electronic balance to weigh them and then record their weights in a table.
Three readings are taken for each concentration in order to get an average and reduce the effect of anomalous results.
Table to show how concentrations were mixed:
RESULTS
As you can see from my table I gathered one set of results at each concentration of sucrose solution and also two repeat ones for accuracy. I then proceeded to work out the percentage increase with the use of the formula below:
% = change in mass x 100
Original mass
On the next page I have used these results to plot a graph!
[Graph Overleaf]
Analysis
The graph shown on the previous page gives the line of best fit for the percentage change in mass of the potato cylinders. The graph slopes downwards and does not go through the origin, and the percentage gain and loss in mass and concentration are directly proportional.
However, there is a pattern on my graph, and this is, as the concentration of the solution increases, the percentage change in mass decreases. The graph shows that the percentage gains and loss is directly proportional to the concentration. This is because the potato chip is becoming as flaccid as it possibly can, and so the change in mass of each molar concentration is becoming closer and closer together.
From the line of best fit that has been added in, it can be seen that all of my points were relatively close together. This shows that my results are fairly reliable.
However, there are two points that look rather odd on the graph. The first one being, when the concentration is at 0.6M and the other being at 1.0M. This could have happened when I was mixing concentrations. I could have accidentally added to much sugar or to much water therefore affecting my results.
Also the line of best fit crosses the x-axis when the concentration is approximately 0.78M. As I mentioned in my prediction this is called the isotonic point – where the concentration of water inside and outside the potato are equal, I believe that this (at 0.78M) is where it happened.
The graph does support my original prediction that was stated earlier on in the coursework. The only problem that occurred was that the recorded results should have been taken to more than one decimal place as this would have given me a much more truly accurate average percentage, thus, slightly changing the shape of my graph.
Evaluation
I think that the experiment went very well, and the results produced quite a good graph. However there were a few areas where there could be improvement. Firstly, when I dried off the excess water on the potato cylinders after the experiment and before I weighed them, I used a paper towel. This might have either taken some water out of the potato or it might have left some excess water on the potato. This part of the experiment is difficult to come up with an accurate and fair method, as other ways would also lead to some slight mistakes.
Also the potato itself was not exactly the same size (I may have ran out of time and just lined the potato chips up and cut them in a straight line), although I did try to cut them to 2cm each.
I could also extend the experiment to a more exact level by looking at the potato cylinders under a microscope, and then I would be able to see the cells in greater detail and draw some more observational results. I could also have taken more results for each mass i.e. 5 instead of 3. This would have made the average mass more accurate.
Finally, I could also investigate into the effects of other factors that effect osmosis in potato chips and again compare my results with these, as well as taking more repeat readings to improve the accuracy of my experiment.
However with all this said I think that the experiment was truly successful and I was very pleased with the complete comparison of my results with my initial prediction.