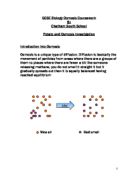
Nice air Bad smell
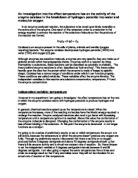
Osmosis is defined as the movement of water molecules from a region that they are highly concentrated to a region in which they are less concentrated. This movement only takes place through a partially permeable membrane such as a cell wall, which lets small molecules go through like water but does not let bigger molecules to pass through like sugar. The water molecules pass both ways. In this diagram, the water will more likely go right.
Diagram of Osmosis
Plant cells always have a strong cell wall surrounding them. When they obtain water by osmosis they commence to swell but the cell wall prevents them from bursting. If it were an animal cell, it would rupture because it does not have a cell wall. Plant cells become turgid when they are in dilute solutions. Turgid means inflated and firm.
If these potato strips were placed in a solution with a low water concentration, then the opposite would happen. Water would shift out of the cell into the solution.
If the situation was fatal, the cell membrane would leave the cell wall and the cell is now to be known as plasmolysed or flaccid. The potato strips will have decreased in mass, length, volume.
Investigation
I will be investigating osmosis and effects it has on plant cells. I will be using a potato as part of the experiment. I will not be using the visking tubing in this experiment. I will be using potato tubes.
Prediction
I predict that when the experiments takes place, the potato strip in the beakers with high sugar concentrations will shrink and lose mass because osmosis is taking place. However, the potato strips in the beakers with low sugar concentration will gain mass. I have given more information below on why I think my prediction is correct.
The smaller quantity and concentration of water in the outer solution means the larger amount of water will leave the potatoes cell. The larger quantity and concentration of water in the outer solution means the larger amount of water will enter the potatoes cell by osmosis. During the experimentation, at one point the quantity of water internal and external will be isotonic, which means equal. All through this period, there will be no change in mass, length and volume because the net movement of water will be zero, so no osmosis has occurred throughout this period.
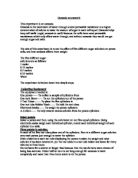
I have made a graph for my prediction, so in the future I can compare my experiments result graphs with my prediction graph. This will give me a more accurate judgement about whether my experiments were successful or not.
Prediction Graph
A proves osmosis has not yet occurred, suggesting that the concentration of water contained by the cell is equal to the concentration of water externally.
C suggests that the cell is not growing further in size. Due to the fact that cell is already completely turgid and no more can enter.
B suggests that the cell is not lessening more in size. Due to the fact that the cell is completely plasmolysed and no further water can leave the cell.
In between point C and A, the potato strip is hypo tonic to the sugary solution and between point A and B, the potato strip is hyper tonic to the sugary solution.
Key Factors
These non-variables will determine and affect my result. Therefore, I will take certain measures on these.
-
Size of potato strips – a larger surface area will take longer for the molecules to go through.
-
Size of beaker – molecules will collide more often making the process longer
-
Temperature of water – molecules moving faster giving also more collisions also if too hot evaporation may take place
-
Kind of potato – salty or sugary. If the potato is sugary the experimentation will be unfair
-
Volume of solution – more molecules will make the procedure longer because of more collisions
-
Concentration of solution – more molecules to collide and will make the tests more longer
-
Length of time of each trials – I will have to leave the potatoes in the beaker for a certain length of time to actually allow the process of osmosis to take place
-
The health and age of the potato – might affect the experiment because when a potato becomes old it becomes soft and bendy. This could make the potato strips absorb less water
Fair test
If any of the non-variables are not kept constant, the trials will not be fair. To create a fair test certain aspects of the experiment will have to be kept the same whilst one important variable is changed. For example if one of the potato tubes were to be one cm longer than the other tubes, the surface area of the tube would be larger so there would be more space for osmosis to occur. To obtain varied results it will be essential to vary the concentration of the sugar solution. From my results, I will be able to make a conclusion. I will take the following actions:
- measure the volume of water
- measure the amount of sugar
- use the same length of potato
- measure the temperature of the water
- size of beaker, if the beaker has a large surface are there will be less collisions making it not fair
- washing beaker after each experiments
- measure room temperature and make sure it remains constant throughout the experiment
- I will keep all of the above the same apart from the sugar concentration solution
Equipment
I will be using these utensils and science equipment for my experiment:
-
measuring cylinder – to measure the amount of water
-
Five 250 ml capacity beakers – for the tubes of potatoes to go in for the experiments
-
borer – to cut tubes from the potatoes
-
goggles – not really needed but good for protecting eyes and looks professional
-
sugar – the solutions that will go in the beakers with the potatoes
-
knife – to peel off skin of the potatoes
-
chopping board – ideal tool to not damage table and good use when I bore the tubes out of the potatoes
-
potatoes – main object for the experiment as it is essential
-
scale (top pan balance) – to weigh the potatoes before and after the trials
-
ruler – measure length of potatoes
Safety
Because this experiment will take place in a high school lab there will safety procedures to prevent any accidents. To make sure that this experiment is safe I will take certain measures including:
- wear goggles for the protection of my eyes
- no running around the lab which may cause fatal accidents
- if a spill has occurred make sure it has been cleaned straight away
- be careful with the knife
- also be careful with the borer
- every stool, bags and coats be underneath the table
- not to leave any experiments unattended
Preliminary Method
I will gather all equipment that will be needed for the experiment.
Solutions – these are the solutions, which will be in each of the beakers.
- 1 molar sugar solution with 200 ml of water
- 0.75 molar sugar solution with 200 ml of water
- 0.50 molar sugar solution with 200 ml of water
- 0.25 molar sugar solution with 200 ml of water
- Only pure water which consists of 200 ml of water
Systematic Method
- Using a knife, I will peel five potatoes
- Using the borer, I will bore holes in the potato.
- Using the scale, I will weigh the tubes and record it.
-
I will put all of the tubes in with the solutions at the same time. The time limit will be ten minutes.
- In the end, I will take all the tubes out from beakers, remove excess water, and weigh.
Results of Preliminary Method
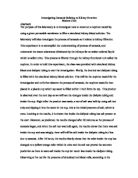
Analysis of Preliminary Method
From my preliminary result graph, I can gather that the graph in any way does not relate with my prediction graph. It does not show that the potato cells increase mass in solutions with a high water concentration and decrease in mass in solutions with a low water concentration. In my preliminary graph the results were jotted down only to make an inconsistent line whereas my prediction graph is a downhill steep line. With all line graphs, you can make an estimate on what the result will be next however for my preliminary graph, I cannot, which means that the experiment was not accurate.
Evaluation of Preliminary Method
I will start another method, as my preliminary method was not adequate for my investigation. My preliminary experiment had many problems of which I created by myself. One reason was that I did not leave the experiment long enough to actually allow the procession of osmosis to go through. Also, I actually confused myself by not knowing which potato piece came out of which beaker. So relating to my preliminary experiment, I cannot say whether my prediction was correct or not as the preliminary results were hectic. To improve the next experiment I will be far more accurate with measurements and organised. I will also increase the time of the experimentation of the potato strips in the beakers to twelve hours, as ten minutes is not long enough. Not only that but I will repeat each concentration three times, which will give me an average. Meaning more accuracy overall and reduce the chance of anomalous results. To be more organised, I will label the beakers of what level of sugar concentration is contained. My preliminary sugar solutions were not accurate as the ratios on which they were mixed was not accurate. So the next experiment, I will use the help of my science teacher.
Final Method
Below I have made a table to show how the concentrations were mixed. As I did not know the mixing ratios, I had asked my science teacher to only help me work out the ratios.
My sugar solutions will be arranged with intervals of 0.2 from 0.0 molar to 1.0 molar. Sections of potatoes will be cut using a knife, borer and will be measured using a ruler. Cutting too much potato will allow more surface area to be exposed to the limitations of osmosis. The mass of each potato will be measured. I will also repeat each concentration three times. 20 ml of each concentration of sugar solution will be put in three test tubes and labelled. In each test tube, I will put in a cut piece of potato and measure each potato pieces mass and write it on the label. These labelled eighteen tubes will be left for twelve hours. After the twelve hours, the potato pieces will be removed. I also will remove excess water solution on the potato pieces using paper towels and weigh them. On paper a table that had previously been made, I will jot down three masses after experimentation of each concentration.
Results of Main Method
Main Method – Average Percentage Change in Mass
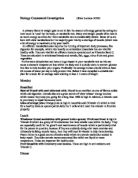
Main Method Graph
Prediction Graph
Analysis of Main Method
My prediction, on which I had made earlier, was supported by my main method investigation. It does show that the potato pieces in the beakers with high sugar concentrations did shrink and lose mass because osmosis took place. Also, the potato pieces in the beakers with low sugar concentrations did gain mass.
The prediction graph may not be spot on with my main method results graph but both have negative correlation. At concentrations above 0.6 molar, the potato pieces did not lose much more weight, suggesting that at the pieces were flaccid and on the stages of becoming plasmolysed. Meaning I can make an estimate when the sugar solution will be 1.2 molar, the percentage change will be around -40. Also, I can say that the isotonic point is around 1.75 molar to 1.8.
Evaluation of Main Method
If I were to repeat the investigation, I still would increase the experimentation time for the potato pieces in the beakers to twenty-four hours. The intervals of the concentrations was fair enough but to be more accurate I would decrease the intervals down to 0.10, 0.20, 0.30 molar etc. This would allow more osmosis to happen and I would be able to find the isotonic points of the experiments more accurately as the one I had made is very rough. For weighing of each potato piece, I could have measured it on a more accurate scale like 0.000 instead of 0.00
But I also may decide to change the plant tissue to a cucumber or carrot. One thing I found hard during the investigation was the cutting of the potato pieces, if one piece was different from the others then osmosis taking place in each piece may have been at different rates, as the surface area would have been affected. So to improve accuracy, I may try to use some sort of machine like a potato peeler and cutter from a fast food store. This would mean every potato piece would be the same mass making it a fairer test. Throughout the experiment, I used a measuring cylinder, which is not always precisely accurate. I could have used a burette or a titration.
One other thing was that when I removed excess water from the potatoes after the experimentation, I might have removed more excess water than others. So in the future, I may find another answer to drying like a hair blow dryer.
Overall, even though I may say so myself, the investigation of my main method was very successful. Also, I was pleased with the comparison between my prediction and main method. I had a number of results from which I was able to make very useful graphs.
GCSE Biology Osmosis Coursework
By
Chatham South School