We will change the concentration of the solution within each boiling tube to gain our results. However, we must keep the amount of concentration the same at 200ml.
Apparatus
- 5 boiling tubes
- 1 large potato
- Test tube rack
- Cork borer
- Ruler
- Measuring cylinder
- White Tile
- 100% Salt Solution (NaCl)
-
100% Water (H2O)
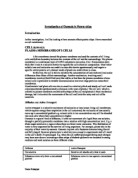
Scientific Explanation
Plant cells have a cell surface membrane, but outside this is the cellulose cell wall. Inside a plant cell there is a solution of salts and other solutes, many of which are located in the vacuole. The cell surface membrane is partially permeable. But the cellulose cell wall is fully permeable to solutes as well as water.
If you immerse a plant cell in water, the water flows through the cell wall and cell surface membrane into the vacuole from the outside. As a result, the cell swells up. But it doesn’t burst because the cell wall stops it expanding too much. The wall stretches but it doesn’t break. When this point is reached, we say the cell is turgid.
Results
All of our chips started at 50mm, here are the results after 24hours in the solutions:
Our results were very pleasing; we felt that there was no need to repeat the experiment. The cells which had become longer now felt hard and had become turgid. The cells which had become smaller in length felt very floppy and had become flaccid. This is because all the moisture has been lost from the turgid chips, and more moisture has been added to the chips which have turned flaccid through osmosis.
I have rounded these results to the nearest whole number to make the results easier to understand, and the pattern should now be clearer.
Explanation
From our results I have found out that the potato chips have expanded in length when the concentration of salt is low, and they have decreased in length when the concentration of salt is high. It is shown clearly in the results table above that the higher the concentration of water, the more the potato chips have expanded. You can see from my graph that the general trend is that the higher the concentration of water, the more the chip has expanded. Also, the lower the concentration of water, the more the chip decreases in size.
Graph
I then decided to present my findings in a graph. First I took an average length of the chips from each solution. I did this by adding the three lengths together, then dividing them by three. I then rounded of the average to the nearest whole number so it would be easier to work with. My average potato chip lengths are:
Then I designed and plotted a graph to show my results more clearly. (See graph attached) On the graph I have drawn a line to show a line of best fit to show the general pattern of the chips from each test.
Conclusion
From my graph, I conclude that the potato chips have expanded in length in a low salt solution because the concentration of water is higher outside the chip than inside. The potato chips in the higher salt solutions have decreased in length because the concentration is higher inside the chip than outside. Osmosis causes the water to move through the semi-permeable membrane of the chips cell wall. I understand that osmosis is the movement of water through a semi-permeable membrane. The water moves from the high concentration of water to the low concentration of water.
Evaluation
I was extremely pleased with the results I obtained. I think they were reasonably accurate and I had no anomalous results. The suitability of the procedure was excellent and proved osmosis well. For more accuracy, I think we could have used more potato chips, so that we could achieve more accurate averages to plot the graph.
I found the reliability of the results good, and think that the evidence is sufficient to prove the process of osmosis. To further this work, I could try different vegetables in different solutions. For example a sugar solution, this would allow me to gain more results.