For the experiments that was carried out, the aim was to investigate the effects of enzyme concentration, temperature and pH on the rate of reaction. The enzyme that was used is called ‘amylase’ which is extracted from a fungi called Aspergillus Oryzae. (P Adam 2004)
Method
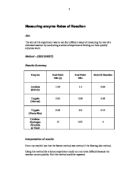
The material and methods for the experiments carried out followed the instructions from (P Adam 2004) subject guide from pages 97-121. However slight changes were made. The changes are shown in the below tables.
Table 3 – Temperature results Obtained
Table 6 – pH results obtained
Results
Table 1 – Absorbance and Concentration of Starch at different times
Table 2 – Mean Values of Starch Concentrations
Table 3 – Initial Enzyme Reaction Rates
Table 1 shows the general trend that the absorbance of the starch-amylase solution decreased as time increased.
Table 2 shows the average values of starch concentration from different groups in the laboratory.
The initial starch concentrations of groups A,B and C started off similar. As the time passed, the differences in starch concentration were being more noticeable. After 3 minutes Group A had twice the amount of starch concentration compared to Group C, the amount increased to three times the amounts after 5minutes. After 10minutes Group A had twice the amount of starch as Group B and 5 times the amount of Group C.
Both table 3 & figure 1 shows the initial reaction rates of each group. Group A had the lowest initial rate of reaction followed by group B, and the highest was Group C.
Table 4 – Temperature Results Obtained
Both table 4 and figure 2 shows the effect of temperature on the reaction rate. The general trend from test tubes A to E is that the rate of reaction has increased as the temperature increased. It started at a reaction rate of 0.09mg/mL/min to 0.48mg/mL/min. Then from test tube E to test tube F a significant decrease in reaction rate was observed, from 0.41mg/mL/min to 0.11mg/mL/min. The results also show that the optimum yield of temperature ranges from 34°C to 46°C.
Table 5 – pH Results Obtained
Both table 4 and figure 3 shows that the optimum reaction rate for pH’s ranges between a pH of 5 to 7. There are significant decreases in reaction outside this range of values, such as pH of 3 having a reaction rate of 0.278 and at a pH of 8 its reaction rate is at 0.03.
Discussions
The experiments have shown the effects of the concentration of enzymes, temperature and pH onto the reaction rate of the amylase enzyme. The results of the experiments are comparable in terms of general trends to other published results (Solomon Berg Martin 2002). Although the results was successful on showing the factors that affect the enzymes reaction rate, there were the success of the experiment, there are still some methods that could be improved upon.
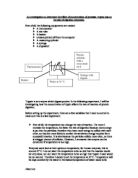
Figure 1 confirms that the higher the concentration of the enzyme, the greater the reaction rate will be. Figure 2 shows that as the temperature increases the reaction rate also increases. This occurs from 0.5°C to 46°C. After that however, the reaction rate dropped suddenly, as the enzymes began to denature. Figure 3 shows that at pH values from 5 to 7 there is optimal activity, as the enzyme is able to function most efficiently in these conditions. pH of less than 5 (acidic) or ph of greater than 7 ( basic) the reaction rate drops sharply as the enzymes become denatured. This is due to the interactions between acidic and basic side amino acid chains. It then leads to the change of shape of the active site of the enzymes, and the binding between the active site and the enzyme no longer occurs. (Campbell & Reece 2002)
To improve these results repetitions of the experiment must made, thus leading to more consistent results. Repetition of experiments will also confirm original results thus removing irregularities in results. Abnormal in results did occur in the experiment. They include test tubes I and L from table 5. The experimental errors could have occurred from contamination from either residue leftover from the pipette used a while ago resulting in a higher starch concentration. The error could of well been a result from the inaccurate readings of temperature & spectrometer, an unreliable standard curve, and the actual time the experiment.
Also, to improve the results of the experiment, more values of temperatures could have been used. Temperature readings at 40°C, 50°C and 65° would lead to a more refined curve.
To conclude, the experimental results was not flawless and has some errors, but the trends in the rate of reactions could be observed. With improvements of methods such as repetition of the experiment and observing the effects of the reaction rates with more values would greatly increase the accuracy of the results.
References:
Adam, P., ed (2004). ‘Molecules, cells and genes subject guide.’ University of NSW: Sydney.
Campbell, N.A. & Reece, J. B. (2002). Biology, 6th Edition, Benjamin Cummings, San Francisco.
Solomon, E.P., Berg, L.R. & Martin, D.W. (2002) Biology, 6th Edition. Brooks/Cole, United States.
Science Line [online] Date accessed: 15 May 2004