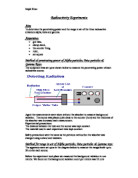
- We started the experiment by making sure the radioactive source was aligned with a ruler to the GM tube as accurately as possible so that the maximum radiation is measured
- A set square was used to measure the exact point at which the source and tube were placed
- The counter was reset each time so the counter read zero so this would reduce zero error in the experiment and the hold button was pressed to freeze the measurement
- Thirty seconds were left between the start of the count and the recording so the reading would be less instantaneous and more reliable
- Everything was kept constant for all three experiments and the counts were recorded at regular intervals of 5 cm.
The safety precautions we took while performing this experiment included removing the sources from a secure wooden box using tongs and tweezers and placed in plasticene, the setsquare was held using tongs and all those carrying out the experiment stood behind the source to minimise any direct radiation exposure.
Table of results and Graphs:
Absorption:
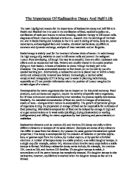
As the thickness of the paper increases the counts per minute of alpha particles decreases. This is true because alpha particles cannot pass through paper. This also agrees to with text as a sheet of paper stops alpha
As the thickness of the aluminium increases the counts per minute of alpha particles decreases. This true because alpha particle cannot pass through 1mm aluminium. From the above it can be seen that some beta particles were still absorbed when the thickness of the aluminium was more than 1mm whereas in the text book it says that beta is stopped by 1mm of aluminium which my experiment doest actually prove to be correct as beta particles are stopped after 2.5mm of aluminium. By 3mm thickness the power is reduced from about 1231 to 7 counts per minute
As the thickness of the paper increases the counts per minute of gamma rays decreases. This is true because gamma rays cannot pass through lead.
The penetrating power of the gamma radiation decreased as the thickness of the lead absorber increased however it is more a linear graph rather than a curve graph therefore suggesting that the gamma still had a considerable amount of power left. This supports the textbook which states that the radiation is stopped by several centimetres of lead.
Range in air
(The graph shows that the count rate decreases with the distance for the alpha radiation. The decrease is quite steep and only levels off during the last 5 mm. Textbooks name the range of air for alpha particles as 5-6 cm but this graph comes short of this limit with the last count measured at 1.5 cm.
The count rate decreases as the distance increases. Again the decrease is rapid and steadies at about 40 cm. The calculated range for beta is 1 m however this experiment counted the last beta emission at 40 cm this is less than half the theoretical range.
The count decreases as the distance increases with a steep curve line. The experiment supports the theory that gamma is not stopped by air but is reduced because at 50 cm there is still a count of about 65 counts per minute.
The range in air experiments agree with the properties of alpha with the least range in air and gamma with the greatest range in air.
Evaluation:
The results were quite accurate as they corresponded with evidence in the AS/A2 Physics (Mee, Cundell, Arnold and Brown) and the Nelson Modular Science (Mark Elise and Chris Honey) books. The results were precise as they followed a nearly uniform pattern of an exponential graph.
However in some of the graphs the results were a bit anomalous. For example on the Beta particles graph the beta particles were was absorbed by 1mm aluminium which isn’t really correct as beta particles should be stopped after about 2.5mm of aluminium