Method
- Set up the apparatus listed in the Equipment List as shown in the Diagram and put on your safety goggles.
-
Using a measuring cylinder, pour 40cm3 of water into the conical flask.
-
Using a different measuring cylinder, pour 10 cm3 of sodium thiosulphate into the conical flask.
-
Using another different measuring cylinder, measure out 5cm3 of hydrochloric acid ready to use when the solution is at the correct temperature.
-
Put the conical flask onto the tripod, Bunsen and gauze and heat, measuring the solution with the thermometer until it is at 30oc.
- Take the conical flask off the apparatus using the tongs, and place it directly over the white paper with a black cross.
- Now, with the stop clock at ready, pour your previously measured hydrochloric acid into the solution, swirl and start the timer.
- Look directly through the solution at the black cross and when it becomes invisible by the cloudy solution stop the timer.
- Record the time and repeat the experiment at different temperatures.
When sodium thiosulphate reacts with hydrochloric acid, sulphur is released as the product of the reaction, thus the solution becomes cloudy. The equation explaining this is shown below.
Sodium Thiosulphate + Hydrochloric acid
Na2S2O3 (l) 2HCl (l)
Sodium Chloride + Sulphur Dioxide + Sulphur + Water
2NaCl(aq) SO2 (g) S (s) H2O (l)
The reaction between the two colourless liquids can be timed from when the two reactants meet to when a cross can no longer be seen through the solution. This is how I will measure the experiment.
There are several factors which will affect the rate of the reaction:
- Temperature – will speed up the rate of the reaction by making the particles vibrate more and collide into each other more often as a result of this.
- Depth of conical flask – will need to be kept the same as different depths of flasks will result in the height of the solution changing which will then change the time the cross is still visible from a top-down view.
- Reactants – the concentrations will have to stay the same and also the amounts as this will make an uneven reaction, providing too little of 1 reactant may result in it being totally used up in reactions and not enough left to be able to produce enough sulphur to change the colour of the solution.
- Accuracy of timing – the same person will have to be used otherwise when the cross disappears there will be a debate at what time it actually did disappear.
This experiment will be a fair test as only one factor will be changed, the temperature, making it an independent variable. The independent variable will be the temperature because it can easily be measured using a thermometer and changed using a Bunsen burner. This will cause the rate of the reaction to become the dependent variable as the increase in temperature will also increase the rate at which the reaction happens, which will be measured using a stop clock. To make it a fair test all other factors must stay the same during the experiment.
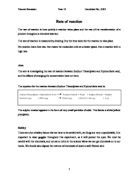
My prediction is that the higher the temperature the higher the rate of reaction. This is justified by the collision theory; the particles must collide with each other and have enough energy to break their initial bonds and successfully react, creating new bonds. The minimum energy that a particle must have to react is set by a barrier called the activation energy or Ea. If a collision between particles can produce sufficient energy to be equal to or higher than the Ea, a reaction will take place. Therefore, not all collisions will result in a reaction. So, to increase the rate of the reaction the number of successful collisions must be increased. When a change in conditions, such as temperature, increases the number of particle collisions increase because the higher temperature makes the particles move faster, with more energy. This means there will be an increase in successful collisions, thus an increase in the rate of reaction. At higher temperatures, more particles have enough energy to react successfully, so the frequency of successful collisions is increased, clearly supporting my theory. Based on this evidence, I predict the graph to look somewhat like this, with a rise in temperature affectively doubling the rate:
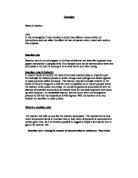
My preliminary work has shown that it is very important to keep everything very accurate; the reactants, temperature and timing are all very important to the outcome of this experiment. It has also informed me of the range of readings of temperatures I will be using; 30, 40, 50, 60 and 70oc. I will do each of these temperatures 3 times for maximum accuracy. Timing will be done in seconds as my reaction to the rate is not fast enough to be done in milliseconds. I also found I would need a way to calculate the rate. The rate of reaction can be measured in seconds-1. This would mean that as the rate increased, the time taken would decrease. Therefore, increasing the temperature would decrease the time. I have also found that when the temperature increased the time in which the reaction took place was lowered. This means the activation energy barrier must have lower for the higher temperatures because at higher temperatures, more particles have enough energy to react, so the frequency of successful collisions is increased. Only particles with energy equal or greater than the activation energy can react when a collision occurs. This means the activation energy graph will look like this:
At higher temperatures:
- the peak is at a higher energy
- the peak is lower and less steep
- the peak is broader
- there is a large increase in the number of particles with equal or higher activation energy.
The final change that higher temperatures affect will result in an increase in the rate of the reaction. For this reason I will start with temperatures above room temperature increasing by 10oc every time so if there is a trend it can be analyzed easier. I will do 5 different temperatures for range to make the experiment more accurate as more temperatures means more comparisons.
Obtaining Evidence
Collecting evidence safely is very important. I will be wearing safety goggles the whole time and using tongs to handle hot surfaces. 5 readings have been taken 3 times to elevate the success of the experiment. Also, after calculating the rate I found that the numbers produced were to exceedingly long decimal places, so for easy use I have kept the numbers to 3d.p. The following results were obtained and constructed into a graph for use to observe a visual relationship between the time vs. temperature and rate vs. temperature.
Analysis
There are two pieces of relevant information I can deduct from this table, the time and the rate of reaction.
Time Graph
As you can see from the graph, as the temperature is increased the time it takes for the fixed amount of reaction to happen is decreased. The steepness of the line of best fit curve shows how rapid the reactions took place. The curve is decreasing steepness steadily of about half as much time as the previous reaction temperature took. Below I have plotted my actual results curve against my theoretical curve. As you can see they both start off very similar at the lower temperatures, but as the temperature increases the actual results curve becomes less steep meaning it took more time for the fixed amount of reaction to happen. However, there is a clear explanation for this which is that as the temperature of the solution got higher the more it differed from the surrounding room temperature, meaning that the heat of the solution will be lost far more quickly at higher temperatures. So the results on my actual results curve are at a lower temperature than what is shown meaning that the fixed reaction period will take slightly longer at the lower temperature.
Rate Graph
The results show that the rate is increased when the temperature is increased. The steepness of the line of best fit curve shows how rapid the reactions took place. The curve is increasing steepness steadily of about twice as much rate as the previous reaction temperature took. Below I have plotted my actual results curve against my theoretical curve. As you can see they both start off very similar at the lower temperatures, but as the temperature increases the actual results curve becomes less steep meaning the rate of the reaction was slower for the fixed amount of reaction to happen. The reason for this is the same as the Time vs. Temperature graph. So the results on my actual results curve are at a lower temperature than what is shown meaning that the fixed reaction period will take slightly longer at the lower temperature. So the rate should double as the temperature increases, meaning my prediction is supported by this experiment as the graph shows.
Evaluation
The experiment overall went as planed but was not as successful as I had predicted it would be. I think the method I used was slightly unreliable due to the fact that the high temperature of a solution will decrease in a room temperature environment. To overcome this, next time I would use a change in concentration of the reactants as my independent variable and let the rate of the reaction remain the dependant variable. I would do this because the molar of concentration will not change when left in a room temperature environment, making my results valid and much more accurate. The evidence I managed to obtain was quite accurate due to the fact that it was repeated 3 times, but not reliable because the temperature can be changed so easily. But, this meant I could get three results then deduct an average from these numbers. I think the evidence strongly supports the conclusion that temperature is directly related to the rate of a reaction in which when the temperature goes up the rate of the reaction is doubled, making the fixed amount of reaction overall happen faster. There were some anomalous results at higher temperatures due to the temperature of the solution become lower when left in room temperature.
To test the relationship between rate and temperature further I will conduct another experiment. I will measure the time it takes for magnesium to react with hydrochloric acid under the independent variable of temperature. When magnesium is placed in hydrochloric acid a reaction takes place and a gas is given off. I will measure this gas to see how temperature will affect the time it takes for the reaction to produce the volume of the gas. The following equation shows the reaction that takes place when magnesium reacts with hydrochloric acid.
Magnesium + Hydrochloric acid Magnesium Chloride + Hydrogen
Mg(s) 2HCl(l) MgCl2(aq) H2(g)
Firstly I will set up apparatus as shown in the following diagram:
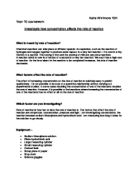
I will then place the magnesium into the hydrochloric acid and seal the conical flask up, so the gas given off (hydrogen) can be collected in the gas syringe. I will conduct this experiment over different temperatures to affect the rate of reaction. I predict that the graph of results will look like this:
When the temperature is at 30oc the particles are moving slowly with little energy so the percentage of successful collisions is low. However there are lots of available particles so the rate at the start of the experiment is high compared with the rate at the end of the experiment where most of the particles have now successfully collided and only a few remain to successfully collide with each other and produce hydrogen. This is why the curve gets less steep as time goes on. When the temperature is at 70oc the particles are moving much more quickly with a lot more energy so percentage of successful collisions is very high, making the curve very steep at the start of the experiment meaning the rate is very high. But the rate overall is lowered due to the remaining particles that have yet to successfully collide with each other after randomly meeting. Thus to calculate the rate I must use the time at when all the particles have collided successfully and produced the maximum amount of hydrogen possible. Here is the graph that was produced:
Again, as you can observe the rate doubles with temperature, in theory, which backs-up my results from the main experiment.