After we tried to do the same but instead of using 10ml we used 5ml of hydrochloric acid. We also decided to only use 0.2 grams of magnesium. At first we were getting a good set of results but then we couldn’t see a pattern in our results. Most of our results were all over the place and we couldn’t get any reliable results. After looking at our method and our results we realised that we had to change something to get a better set of results. We had a look at changing the calcium carbonate to magnesium and we did one initial testing and we got some good results. It was much better as we were able to keep our method the same.
Preliminary investigations are useful to any investigation as they allow you to spot errors in your method. As you can see from our investigation we used preliminary to make sure at the end we get the best set of results we can get because we tested around with all different reactants to find one that was most suitable to this investigation. We also used preliminary to test if all the equipment that we choose to use was working well and that we would be able to use it successfully when performing our experiment.
Method
Reaction
Red- Reactants
Blue- Products
Hydrochloric Acid + Magnesium Magnesium Chloride + Hydrogen
HCl + Mg MgCl + H
Equipment
.Water bowl- We use this to make sure that we don’t lose any water when we put the burette in
.Burette- We use the burette to measure the amount of hydrogen produced to get our results
.Clamp- We use this to hold the burette upright, so someone doesn’t have to stand and hold it up
.Reaction Flask- We use this to perform the reaction in
.Delivery Tube- We use this to allow the hydrogen from the reaction travel from the reaction flask to the burette
.Measuring cylinder- We use this to measure the amount of hydrochloric acid we use
.Scales- We use this to measure the amount of magnesium we use
.Water bath- We use to adjust the temperature of the hydrochloric acid
.Hydrochloric acid- We use this to get a reaction along with magnesium
.Magnesium Ribbons- We use this to get a reaction along with hydrochloric acid
.Water- We use this to fill the water bowl and the burette
.Stopwatch- We use this to see how long the reaction has been running and to get our results at certain times
.Thermometer- To be aware of the temperature of the hydrochloric acid
.Scissors- To cut the magnesium strip
1) First collect all the equipment that we will need for this experiment- Before I started I evaluated what we would have to do and I made a decision on the sort of equipment that we would be using. Each piece of the apparatus has been evaluated to check that it works well for the experiment that I have chosen to do.
2) Fill the water bowl with water; make sure that the water bowl is ¾ of the way full- We do this to make sure that we don’t lose any water when you put the burette into the water bowl. We found that it has to be ¾ of the way full to make sure that there is enough water in the bowl to make sure that we don’t lose any of the water when we put the burette in.
3) Fill the burette right to the top with water, then put your thumb on the top of the burette and put it into the water bowl, hold it there until you get the clamp- We use the burette to measure the amount of water displaced. We chose to use the burette for this as it was easy to read of. It has the numbers down the side so we can see how many ml we are losing. We have to put it into the water bowl to make sure we don’t lose any water before we perform the reaction
4) Get a clamp and tighten the burette so it stands upwards with nobody holding it- We use the clamp to hold the burette up. It makes the experiment much easier as you don’t have to have someone standing there just holding it up
5) On the burette make sure that the water is at 50ml, you can change this by allowing water to go out by turning the screw- This has to be done to make sure that we have the correct amount of water in the burette and that when we get the results they will have been started from the same amount.
6) Collect the jar and delivery tube and stick one end of the delivery tube up the end of the burette, this has to be done quickly- We do this as this is where the gas from the reaction goes up and it goes through the delivery tube and will then go up the burette, this is how we measure how much water is displaced.
7) Measure 5ml of Hydrochloric acid and then place in water bath for the temperature that the reaction will take place at, the amount of hydrochloric acid must stay the same for each experiment to make sure that I keep it a fair test - We use the measuring cylinder to measure 5ml of the hydrochloric acid, the measuring cylinder is good as it is easy to get the most accurate measurements that you need. The water bath is very important as it will be used to change the temperature of the solution so we can perform the experiment. We will use it as it is easy to get the solution to the temperature you need for that test.
Here are the different temperatures we will be testing:
20˚C
30˚C
40˚C
50˚C
60˚C
8) Whilst the hydrochloric acid is in the water bath measure out 0.2 grams of magnesium using the scales- The scales are used to get a accurate measurement of the magnesium that we will be using. The amount of magnesium stays the same and we must make sure that we only use 1 strip of magnesium to keep the surface area the same.
9) Put the thermometer in the hydrochloric acid to make sure that it is at the correct temperature- We use the thermometer to make sure that it is at the correct temperature for our experiment. If it is not at the correct temperature then our results could look strange and would be wrong.
10) Then put the 0.2grams of magnesium into the reaction flask and pour the hydrochloric acid once it is at the correct temperature. You must then put the lid with the delivery tube on immediately and start the stopwatch- When doing this you must make sure that you use 0.2 grams for all tests and must only use two strips of magnesium for all tests. You do this to keep a fair test.
11) You then check how much water is left in the burette after every twenty seconds for two minutes- You do this as this is how we can check the rate of reaction and this is why we use the stopwatch, it is easy to use and is much more accurate than counting in your head.
You then repeat the steps but each time you use a different temperature.
Results
Interpreting Results
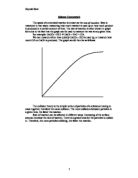
After I got my results I decided to draw a graph to test the strength of my results. From the first graph I can see real evidence that as the temperature increases the rate of reaction increases. From the graph I can see that as the temperature is increasing there is more chance of more water being displaced. You can also see from the graph that we are seeing a curve. We can see from the graph that at first lots of water is being displaced and then as the reaction goes on the reaction starts to slow down and then the curve starts. From the first graph I think it is fair to say that there is a positive correlation between temperature and rate of reaction. I took the results from 40°C from my second set of results because these fitted better with the graph and seemed more accurate. After I repeated the experiment at 40˚C I could see that there is a real difference and that the repeated results are a lot clearer.
From my second graph I can see how temperature affects the amount of water displaced after a certain amount of time which was two minutes. It shows me that as the temperature increases the amount of water displaced also increases which is what I would have expected to see. I can also see that as the temperature is getting higher the difference between the amounts of water displaced is getting bigger. This shows me at higher temperatures there are bigger reactions. From my third graph I can compare the two different tests I did at 40°C with the mean average. I noticed that the lines start wide apart but gradually get closer as the reaction goes on. I can also see from my error bars that the results after 40 seconds maybe inaccurate as the lines don’t run within the error bars, however the other results all do so that proves to me that the results are fairly reliable.
Scientific Understanding
My initial prediction that I made was that as the temperature increases the rate of reaction increases. I said this because of my scientific understanding of the topic. I now have results that back that statement up. My scientific understanding is that the rate of reaction in most chemical reactions will increase through certain variables. The one variable that I choose to investigate was temperature. As the temperature increases so will the rate of reaction. This is because at higher temperatures the particles have lots more energy at higher temperatures. This means that there is going to be more collisions because the particles are moving round quicker because they have more energy. It is like imagining a box of balls and another box of balls, which are the same size because the concentration is kept the same. However in one box the balls have a lot higher temperature meaning that the balls have lots of energy. As these balls have more energy they move around quicker, meaning that the balls are bumping more leading to a faster reaction. In the box were the temperature is lower the balls aren’t moving around as quickly leading to a slower reaction rate.
I also saw on my graph that I could see a curve. This is because at first all the particles with lots and lots of energy are bumping into each other and reacting. After a while most of the particles would have reacted meaning that there wouldn’t be as many particles left to react. This means that it is harder to get a reaction as we go on because there are less particles bumping into each other and getting a reaction. This is why we see the curve because at first most of the particles have made a collision meaning more reactions but then as there are fewer particles to react the reaction slows down as there will be less particles bumping into each other. So from my graphs I can see that there is a positive correlation between temperature and rate of reaction and I have scientific understanding to back that up.
I also saw on my second graph that the rate of reaction gets a lot bigger as the temperature gets quite high. This is because at the lower temperature( 20,30 and 40°C), the balls are still not really moving around quick enough because the temperature is not yet high enough. However at the higher temperatures ( 50 and 60°C) the balls are moving around a lot faster leading to a bigger increase in rate of reaction. So even though you are still only increasing them by 10°C each time there will be changes in the pattern of the results. I would predict that if we measured at higher temperatures the higher we got the steeper the line would be on the graph.
Evaluation
I think on a whole the data that we have collected shows a positive view on the method that we performed. I think the method that we did worked well and it was good enough to get a real solid set of results. However there are a few things that me and my partner could have done to make it better. The main improvement that we could have made was making sure we prepared the temperatures from the beginning. What I mean by this is instead of after each one reaches a certain temperature take it out and put another one at a different temperature we could have put them all in together. This would have saved us a lot of time because the hydrochloric acid would already be near the temperature we need. Through our method we were able to get accurate results which showed in our graphs were we could clearly see that as the temperature increases the rate of reaction increases. To make are method even more accurate I could have made sure that I used more precise ways of measuring, what I mean by this is that I could have been more accurate on getting exactly 5ml of hydrochloric acid. If I was slightly over 5ml it would give me inaccurate and unreliable results. It wouldn’t be reliable as I am not in complete control of one of the variables which is concentration. I also feel in my method I would need to spend more time in make sure I controlled all the variables completely to make sure that I got the most reliable results I could get. I feel if I was to do the experiment I would make sure that before each test I do I check all the variables that would make my results inaccurate if changed. If we did this we would have even more reliable results and would probably be more accurate.
The apparatus that we choose to use was very good and I think that it was successful in getting a good set of results. All the apparatus worked fine and was easy to use, they were also easy to handle. Maybe one thing that we could have done to get even more accurate results was get a smaller measuring cylinder with smaller figures. Sometimes it was hard to get 5ml exactly because the measuring cylinder was quite big and maybe sometimes I was slightly over or under as the figures on the cylinder was a lot larger than 5ml. Other than that I feel like the apparatus that we choose to use worked well and I wouldn’t make any changes even if we were to do it again other than the measuring cylinder.
One thing that we could have changed if we were to do it again with more time is collect the data using bigger quantities of reactants and maybe more time to take the results. For this experiment we choose the write quantity of chemicals to use. However if we were to repeat it again we could have performed it using more reactants on a bigger scale. To do this though we would have needed more time and we have needed to get different equipment. However I feel we would get even better results because we would have been able to take the reaction over longer periods meaning that the results would have been over a longer period.
After looking thoroughly at the data I think that it is fair to see they we have got a good set of results that clearly show a correlation between temperature and rate of reaction. However the data would have been better if we would have had done repeats for all the results. After the first set of results we got we decided that they would be good enough as they match the theory behind it. However to make these results more reliable we would have needed to do a full repeat of the results. This would have made the data that we collected a lot more reliable making our conclusion a lot more reliable. We did perform a repeat at 40˚C because we saw that the results we got in the first test didn’t fit and we classed some of the results at 40 as outliers. After we performed the repeat we got a lot better set of results and the graph we drew was a lot better. We initially did plan to get a set of results which included a repeat for every temperature however we did not have enough time. Time is always a key issue for chemists who are trying to get a new scientific discovery. Whether it is for a major discovery or if it is just for a small experiment like we did. Chemists are always pushed for time because if you get your discovery out first that will mean more profit and a lot more publicity, so chemists are always trying to get the evidence as quick as they can. It isn’t exactly the same for us however it is an example of how chemists can be pushed for time.
Conclusion
I think to conclude we could say that the results that we have got defiantly show a positive correlation that as the temperature increases the rate of reaction increases. Although there are weaknesses in the data that we have got, with the major one that we haven’t performed more repeats which makes our evidence less reliable. I do think that the conclusion that I made is defiantly shown in the results and matches that of what I already knew through my scientific understanding of the collision theory. If we were to make these results stronger we would have to perform more repeats so that we have evidence that is strong enough to be giving as evidence for the conclusion. I also feel it would have been good to take some measurements at higher temperatures to see if the results still matched that off the earlier results taken. This is a thing that if I was to do again I would have done to increase the strength of these results. I feel that this experiment worked well and we have the base for a solid set of results.