- The diameter and the length of the Mg must be the same because the more surface area of the Mg the longer the reaction will take to finish. So at all stages of the experiment the dimension of the Mg must be the same.
- The rate of reaction is also influenced by how many Mg strips are present in the acid solution. Through out the experiment there will always be one Mg strip In the solution if there is more than this then the reaction time will increase because the Mg ribbons will provide an increased amount of surface area so there will be more Mg particles to collide with the acid particles.
- The experiment will take place in room temperature so each time a reaction happens it will have the same amount of temperature surrounding it. It is important for the temperature to be the same, as it will have a massive influence to the amount of collisions. If the temperature is increased then the particles motion will increase as will there for the contacts between the opposite particles will be heavy and in parallel the success rate would have increased making the reaction time faster. The opposite will happen if a low temperature surrounds the solution.
- The size and volume of the beaker has to be the same. The beaker is where the reaction is going to take place. The material of the beaker must be the same as well; I will use glass because it is highly transparent which is very easy to see through where as plastic is not.
- The device to measure how much hydrogen (gas) is produce must be constant the whole experiment because the same accuracy needs to be applied to monitor the gas given off.
- The cotton wool plug must have the same mass through out the experiment because this would have an influence to the overall weight. The cotton wool must also block the entire opening of the conical flask so whilst the reaction is taking place none of the solution is lost.
Preliminary Data
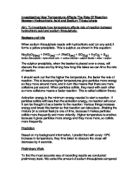
Diagram of the experiment:
Other equipment:
Method of the preliminary experiment:
- Set up the equipment like the diagram above.
-
I measured 25 cm3 of 1M hydrochloric acid by a measuring cylinder then added it into a conical flask on the weighing scale including the cotton ball. I noted the reading on the scale at the start.
- I then measured 8cm length of Mg ribbon and inserted it into the conical flak and immediately placed the cotton wool on and started the stop clock.
- I read the weighing scales every 15 seconds for 1minute and 30 seconds. Then I recorded the results in the table
- I repeated the experiment two more times.
Preliminary experiment:
The first part of the preliminary experiment the method I used wasn’t accurate enough to measure the gas produced. This is because the weighing scale I had used, to measure the gas produced was not appropriate because the scale wasn’t accurate as there was no decimal places on the scale to measure the hydrogen produced. This problem was resolved by using a more accurate weighing scale to measure precisely how much gas was produced during the reaction. The weighing device I had used to do this experiment had measured the weight by two decimal places this was enough to measure exactly how much hydrogen was produced. A problem had occurred with using this weighing device. The scale was too sensitive, so the weight increased with movement that was surrounding it this had given anomalous results.
Whilst carrying out the first trial, I had realised that the reaction between hydrochloric acid and magnesium lasted quite short amount of time because when it got to the last minute the reaction had already finished. This is why I had chosen to record the weight down of the reaction every 15 seconds instead of 30 seconds. So I had chosen to monitor the amount of the gas produced every 15 seconds. I had calculated the average by the three trials that I had investigated on.
I have decided to approach this experiment another way when I do my actual rate of reaction experiment. The reason being was that it was difficult to use the weighing scales to carry out this experiment so instead for my actual experiment I will be monitoring the gas produced by the syringe. This is because the syringe will identify more accurately on how much gas is produced during the reaction, as delicate movement does not affect it.
The actual experiment:
The 5 different concentrations of hydrochloric acid I will be using in my experiment are, 0.3M, O.4M, 0.5M, 0.6M and 0.7M. I will achieve these concentrations by diluting 1M of HCl with water. I will have my weakest concentration to be 0.3M because the reaction would not be too slow this would save a lot of time because if I use 0.1M the reaction would be very slow. So using 0.3M as the weakest concentration would be appropriate because it would show the reaction at a decent time scale. I have decide 0.7M to be the strongest concentration this also is appropriate because the reaction wouldn’t be too fast so it would be easy to record the amount of hydrogen produced in the acquired time interval.
Carrying out 5 different concentrations would let me see a trend once I create graphs from my results thus giving me a wide range of results to analyse. For each concentration I will carry out 3 trials just like I had done for the preliminary experiment this would give me an average and make my results more reliable.
This table shows the concentration I will be using for my experiment:
Dependent and Independent variables:
My dependent variable in this experiment will be the temperature and the dimension of the magnesium ribbon. The length of the Mg ribbon will be 8cm and the experiment will be held at room temperature this will be constant through out the whole experiment.
In this experiment there will only be one independent variable this is the molarity of the hydrochloric acid. This is going to going to vary time to time in different stages in the experiment, this is because I will be investigating how this affects the rate of reaction.
Prediction for Independent variable:
In my experiment I will have the hydrochloric acid as the independent variable. I predict that if I decrease the molarity of the HCl then more time will be taken for the rate of reaction to occur. This is because fewer particles will be present in the solution so less chances of collisions taking place with the Mg particles, so the reaction will be slower. The way I will decrease the molarity of the HCl is by diluting a certain proportion of water into the hydrochloric acid while decreases the amount of HCl. As there will be fewer particles in lower concentrations of HCl then there will be a lower probability of the particles overcoming the activation energy, as it will be more difficult for the particles especially in room temperature to create a successful reaction.
Safety precautions during the experiment;
- Ensure all coats and bags are put to the side to prevent accidents (tripping), so the working area is tidy,
- Wear safety goggles at all times during this experiment,
- Be careful when handling chemicals,
- Clean the surface area if spillage has occurred with a dry cloth,
- Work at a steady pace to avoid accidents.
- When diluting the hydrochloric acid pour the water into the acid, prevents splashes.
The method of the experiment:
Step 1- Set up a retort stand with a clamp firmly fixed onto it. Then in-between the jaws of the clamp place the syringe firmly in. connect the delivery tube with the syringe ensure no space is left.
Step 2- Measure the amount of hydrochloric acid and water needed (depends what stage) to get the correct molarity in a 100cm3 measuring cylinder for each liquid. Use a pipit for better accuracy and ensure the meniscus level is correct to the correct to the right measurement acquired, carry this out on a balanced surface for better accuracy.
Step 3- Then dilute the water with the HCl into one measuring cylinder. The total should be 100cm3; this should give the required molarity.
Step 4- From this measuring cylinder pour in 25cm3 of the solution into a conical flask. Measure 8cm of Mg ribbon, condense the 8cm of Mg ribbon so it can fit through the opening of the conical flask.
Step 5- Get a partner to prepare the stopwatch, make sure the display reads 00.00 seconds. Put the 8cm of Mg ribbon in the conical flask containing the 25cm3 solution, immediately close the plug with the delivery tube stuck on it securely and start the time.
Step 6- One person in the group should be responsible for reading the gas (hydrogen) produced on the syringe as the judgement needs to be unique. One person should read the time and one person to record the results.
Step 7- Then every 15seconds record the amount of gas produced by reading the syringe stop until the time gets to 90seconds.
Step 8- Drain out the conical flask and rinse the flask with water then dry it with a clean dry cloth.
Step 9- Re-do this exact method two more times. This will increase reliability and the 3 outcomes for each molarity and time interval can be found a mean.
Analysis:
My graphs show as the time increases the amount of hydrogen gas also increases, during the reaction between hydrochloric acid and magnesium. I have realised that the time and the amount of gas produce are parallel to each other but then again when the concentration of HCl increased to 0.5M the line started to curve slightly. The graphs 0.3M and 0.4M there is a direct proportional change between the hydrogen released and the rate of reaction. Between 0 to 90seconds the reaction was constant. I think this illustrates that the concentration of HCl was too low and the proportion of its particles was dominated by the water molecules in the solution, which had prevented the reacting particles to collide. This is the reason for the reaction to be slow as the collisions occurred less frequently as shown by the straight line on the graphs. The activation energy has to be kept at a minimum to make it easier for particles especially at room temperature to create a successful collision. If the activation energy is high then a small fraction of collisions have enough energy to overcome the activation energy and the success rate of collisions is low, but in this experiment I had no control of the activation energy.
The 0.5M graph is were the curve starts to develop but going further onto 0.6M there is more proof of the curve being formed. So therefore the last graph 0.7M of HCl displays an obvious curve shown at the tip of the best-fit line. The rate of reaction at 0.7M was quite rapid because the HCl was highly concentrated so it contained a lot of particles to collide with the magnesium, which had obviously created many successful collisions. The collisions were more frequent so the reaction was fast and vigorous, this is why 0.7M had the most recognizable curve. The curve just shows that the reaction is almost finished. By this particular graph I am convinced that if I had reacted 0.9M of HCl with Mg I would see a definite curve with the line completely flattened out between the time interval of 0 to 90seconds.
All five graphs show as the concentration increases so does the rate of reaction, before carrying out my experiment I knew this would happen as the collision theory has justified this point already, the higher the concentration of an acid the more frequent the collisions will occur therefore faster the rate of reaction. All my results prove this fact to be true. The trend for each graph shows the gas produced increases with the time. The amount of gas produced for each time interval for all the graphs are different for example 0.3M of HCl shows at 15 seconds the hydrogen released was 2.8cm3 but 0.4M the gas produced was 3.3cm3 at that same time. This is another factor that clarifies at higher concentrations hydrogen released is quicker therefore faster the rate of reaction.
This table shows the rate of reaction for each concentration of HCl.
Another key factor is the gradient for each graph. This analysis the rate of reaction on how the concentration influences the outcome of the speed of the reaction. The gradient shows the actual speed of the whole reaction. The graph 0.6M the gradient was 0.46cm3/s this is almost three times the amount for the 0.3M graph (0.15cm3/s) accordingly this tells me if the concentration is doubled the gradient increases three times more this declares the fact how the concentration of an acid influences the rate of the reaction.
I have come to a conclusion that as the concentration of HCl had increased the gas produced at each time interval had also increased therefore the rate of reaction was fast. As I had mentioned before the primary factor to rate of reaction is the amount of reacting particles in a solution. If there is a low concentration of particles then the probability of them colliding would be low as well so the reaction would be slow. However at higher concentrations the collisions are much more frequent so the probability of successful collisions are likely. This is because there is a greater possibility for particles to collide with enough kinetic energy in addition to overcome the activation energy.
I had made a prediction at the beginning of the experiment which was, the higher the concentration of the hydrochloric acid the faster the rate of reaction therefore the quicker the gas production will be in the specific time interval. After having done the practical work on rate of reaction I have come to realise that my prediction is correct.
Evaluation:
The results I received from my experiment I think are very precise because I had designed 5 graphs that had different concentrations of HCl and none of them contained an anomalous point. The best-fit line for all the lines had the plots either on it or very close to it so this is how it can be justified that my results from my experiment are accurate. I think the syringe method was a suitable procedure to investigate the rate of reaction (gas given off) because the syringe did gather the amount of hydrogen released during the reaction pretty accurately. The other positive factor about using this method is that it was very easy to obtain the results and to repeat the same procedure two more times.
There were downsides to this experiment, which had not been as precise as the other factors with in the whole experiment this was the excess water remaining in the conical flask. This had occurred because I only had one conical flaskto carry out the entire experiment with and the opening of the conical flask was too narrow, subsequently I couldn’t dry the excess water off after having to rinse it out with water therefore increasing the proportion of water in the solution. The conclusion to this was that the concentration of hydrochloric acid had decreases, this had lead to the reacting particles to collide less frequently thus reducing the speed of the reaction. This may have been a reason for some plots on the graphs not to be exactly on the best-fit line.I could have improved this situation by using dozens of conical flasks one for every trial or even just blow dry the used conical flask.
The experiment was held at room temperature so there was not an exact fixed temperature that had surrounded the solution. The room temperature must have varied time-to-time this may have been caused by body heat lost to the surroundings by students in the class. This would interfere with the reaction giving the particles more kinetic energy therefore altering the hydrogen released. I could improve this situation by carrying out the experiment in a class with very few students, this would decrease body heat lost to the surroundings.
All this said I still think very strongly that all my results are reliable and accurate enough as there were no anomalous points on either of my graphs as a result giving me a successful conclusion to rates of reaction. All my evidence that I had obtained from my experiment are accurate for instance my tables and graphs. I had recorded all the relevant information that I needed from my experiment onto a labelled table, which then I had created my graphs from. All my graphs approve that my evidence are accurate because neither of the graphs have an anomalous point even though some plots are slightly off the best fit line. So my evidence is sufficient to support the conclusion to this investigation.
I would extend my investigation by carrying out more concentrations of HCl and maybe using other chemicals such as sodium thiosulphate to contrast the rate of reaction between the two. This would let me know how different chemicals influence the rate of reaction and this can also help me to compare the results, which would give me a far better conclusion. In order for this to happen I would have to keep everything constant for both the chemicals like the temperature and the amount of Mg ribbon. The exothermic reaction had affected the outcome of the reaction causing more collisions therefore making the results less accurate. If I placed the conical flask in a temperature controlled container it would improve the accuracy of gaining better results. If I had to repeat this experiment again I would perform it with the Burette method because I have found out that this method guaranties more reliable and accurate results so I would gain more precise graphs.