See separate sheet for apparatus
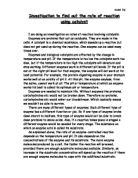
Procedure
After getting all my equipment together I will then do the experiment at least twice, I would like to get three experiments done but maybe the time given would not allow me to do this. I would like to have three sets of data so I could compare the results, looking for trends and anomalies, if I had three sets of results this would be easier.
To get my data I would set up all the equipment; the test tube connected to the gas syringe using the rubber tubing. Then I would get my first data on the 0% concentration and then work my way up using a higher concentration each time, washing out the 5ml syringe each time so I would not contaminate the different concentrations of H2O2. I would put the H2O2 in slowly every time in all my experiments, this would be so I do not lose oxygen by giving the substrate energy to break down before the experiment had started. I would then put the bung with the syringe through it in the test tube. I would stir the enzyme solution, this is because the enzymes are in suspension and could be unevenly spread out through the water, and then collect it using the 1ml syringe, because a 1ml syringe is more accurate for collecting 1ml than a 5ml syringe is. I would then inject the enzyme solution through the syringe needle in the bung quickly into the H2O2 for all of my experiments; I will inject it quickly because it is one of the factors I am going to control throughout my experiments. I will then measure the amount of O2 given off at regular 20-second intervals. From my preliminary experiment, I chose to record the volume of O2 given off at 20-second intervals because I thought 30 seconds was too long an interval and 10 seconds was too quick an interval.
I expect that as the concentration of H2O2 increases then so will the rate of reaction and the volume of O2 will also increase. I think this because if the concentration increases, which means the higher the concentration of H2O2 then the more H2O2 molecules there are in the same volume, and because of this there will be more collisions more often between the enzymes and the substrate then the rate of reaction will increase. In addition, the volume of O2 given off will also increase because of the amount of substrate in solution is greater and so more can be broken down into O2. I would think that as the concentration doubled then so would the amount of O2 given off, because if the concentration doubled then the amount of substrate that can be broken down into O2 has also doubled, and so twice as much oxygen would be given off.
I will put my recorded data into a table like this:
Factors
There are many factors that could affect my results and I hope to control all of the ones that I can; I cannot control things like atmospheric pressure. However I will be changing one factor (the concentration) throughout the experiment for it is the factor in which I have chosen to change to help me in my investigation.
Here is a list of factors that I will be controlling through my experiments:
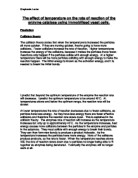
- Temperature-the higher the temperature the quicker the mixture diffuses and there will be more collisions in a shorter time. Unless the temperature exceeds 45C then the enzymes will denature and will not function properly.
- Stirring-yes or no for all experiments? if I stir the mixture I am artificially making the molecules collide and so am speeding up the reaction; if I do stir the mixture then it must be at the same speed throughout all my experiments.
-
I need to put the H2O2 in the test tube at the same speed each time, optimally slowly so the breakdown of the substrate does not start before the experiment has because of given extra energy when putting it in the test tube.
- Stir the enzyme solution, this is because the enzymes are in solution in the liquid and might be in uneven distribution in the liquid, so if you draw up some enzymes form one part and then another part they could be different concentrations.
-
To make the time between putting the H2O2 in the test tube and starting the experiment as short as possible, this is to minimize the natural breakdown of the substrate.
- Using the same equipment for each experiment because a differ in equipment could lead to a slight difference in results than if the same apparatus was used.
- The same angle of the gas syringe has to be used. If the angle is difference then the force of gravity on the syringe will be different, and therefore the oxygen will be able to push it easier/harder depending on which the change in angle has occurred.
- pH. The pH can affect how the enzymes reacts, either by slowing them down or speeding them up; most enzymes only work well in a certain pH and can only tolerate a slight change of pH to either side (+1 or -1). I can do little to control this factor.
- Atmospheric pressure can affect the volume the oxygen takes depending whether or not it is high or low pressure. In order to get round this I will try to do all the experiments on the same day, if I cant then there is nothing I can do about this factor.
Obtaining
In my investigation I used equipment that is suitable for it and that would help me conduct it, for example I used a gas syringe to collect the oxygen given off instead of using the first technique, which involved detergent and the gas being collected in it, this is unreliable. I used the gas syringe because it is relevant for my investigation; there are two ways in which I could measure the rate of reaction these are: 1. measuring the rate at which the reactants are being used, it is difficult to measure this in this reaction. 2. Measuring the rate at which the products are given off.
I chose to measure the rate at which the products are given off because it is easy in this experiment, the product is a gas and can easily be collected in a gas syringe. The easiest and the most accurate way in which to measure the gas being given off was to use a gas syringe and so I did. Also it was the most accurate way in which I could measure the rate at which the gas was given off, the other type of experiment I was able to do was inaccurate in the way in which it measured the amount of gas being given off.
My result tables are shown on another sheet; I have three different sets of results.
I have taken the measurements to a half a unit, the unit being 1cm3; this makes my data more accurate.
Analysis
To be honest the data I collected was not what I expected, to me it seems wrong, but it is not because I got the same results in multiple experiments. I did four experiments and five at 100% concentration of H2O2, the first experiment was done on the first day and appeared correct (this experiment is used in my graphs and tables), the second experiment was done half and half on two different days, and the last two experiments were done on the same day (these experiments are used in my graphs and tables). My first experiment went as I thought it would, as the concentration doubled then so did the volume of oxygen given off in the same time. This was because there were twice as many particles in the doubled concentration and so the number of collisions and reactions doubled, so twice as much oxygen was given off. However, in my other experiments the results showed the same patterns up until 50%, the patterns being: as the concentration doubled so did the rate of reaction, and twice the concentration twice the volume of gas given off. After 50% the readings started to look ‘weird’, the results were not what I expected; in the two experiments I did on the same day and which I have used in my graphs the 100% concentration was less productive and had a slower rate of reaction just above 50% and far below 75%, although I expected it to be twice as productive and twice as fast in the rate of reaction as the 50% (see graphs). At first I thought I had done the experiment wrong but I did a repeat of the experiment and it showed near enough the same results; I even did a second repeat at 100% to positively make sure I was doing the experiment right, the results were the same and equally as ‘weird’. However, the method in which I did my experiment was the exact same in every way in which I got my first set of results, but this time the 100% results were not the same, I can only put this down to the solutions of H2O2 being different of those that were used on the first set of results. Also because I thought my experiments were wrong I asked other people doing the experiment how theirs was going, and they too were having the same anomalies.
As you can see from my graphs, as the concentration goes up so does the rate of reaction and volume of gas given off. On my ‘rate of reaction at 20 second’ graph you can see the anomalous ‘odd’ results I was talking about, 100% and 75% is less than 50% apart from the 3rd set of results which I got on the first day and with the different set of solutions. Also from that graph one of my predictions is proven right; as the concentration doubles so does the rate of reaction.
Another one of my graphs that measures concentration and the amount of Oxygen given off also proves the other one of my predictions. The other prediction was that as the concentration doubled then so would the amount of oxygen given off in total; I thought this because if the concentration doubles then so does the number of substrate particles, and this means that double the concentration then double the amount of oxygen should be given off.
Evaluation
I think that my experiment went well and that my results are accurate and relevant to my investigation; I did the experiments accurately measuring to a half a cubic cm of oxygen, repeating the procedure so I could compare results and taking measurements after 20-second intervals with the use of a stopwatch to help me keep the time accurately. Although I did get those results I was not expecting, I repeated the experiment to prove that it was not my method that was producing the ‘odd’ results. Also I asked other people in the classroom what there results and they were finding that there results were similar to mine; the 75%&100% solution were producing less oxygen and the rate of reaction was slower than 50%.
Although my method was valid and accurate to my investigation, there are ways I could improve it. I only got four full sets of data; three of those were on the same day, one set of results I got on the first day and two on a different day. One of the sets of data was collected half-and-half on two different days and so was not used because it went against one of the factors I was to control. To improve the reliability of my results I could have collected a bigger sample of data, the more data collected the more accurate an average can be made and more data can be analysed and evaluated. Also the equipment I used was suitable for my investigation, I did the gas syringe experiment instead of the size of the foam tower because it was ore accurate; it was the most accurate equipment and experiment that I could do in the lab.
I have plotted the results from my data on many different types of graphs, showing a range of data, hopefully this will help a person to understand my investigation and the results I got for it more easily. However there are a few points I need to make, some of my results may seem like anomalies (75% & 100% producing less oxygen than 50%) but they are not because I repeated the experiment in which I produced these results twice, and I used the exact same method as I got my first set of data that was what I would have expected it to be. The results were the same from the repeated experiments, other people in the class were having the same results, and so they are not anomalies. On my ‘volume of gas given off after time’ graph, you can see I have circled two crosses in different colours; the two colours represent different concentrations used. But the circles round them mean that they did not fit on the line of best fit that I drew through the majority of the points, the line of best fits indicates the expected rate of reaction between the two points on the graph. Therefore, these are the two anomalies in one of my complete experiments. One of the ways to make sure that anomalies do not affect my investigation is to repeat the results; I did this and so used all my data in my investigation and so the anomalous results did not affect the conclusion.
Conclusion
As the concentration doubles the:
- Volume of gas given off doubles because there are twice as many particles of H2O2 that decompose into oxygen, and if left until the reaction is complete then there will be twice as much oxygen.
- Rate of reaction will double because there will twice as many particles and therefore the chance of a collision between the reactants with enough energy will be double, and therefore the rate of reaction will be twice as quick. This is true until the maximum rate of reaction is reached, an enzyme only works up to a maximum speed.
All the data I have collected backs this conclusion up until 50% were things don’t seem to fall into place. But in the experiment I did on the first day you can see that it supports my conclusion al the up until 100% concentration.
This is true up until the maximum rate of reaction of an enzyme is reached; an enzyme has a maximum rate of reaction and can work proportionally quicker as a factor proportionally increases until it reaches a maximum rate of reaction.