Prediction:
I predict that if I keep the mass of marble chips the same as I decrease the concentration of Hydrochloric Acid I add the rate of reaction will slow down and therefore the amount of gas being given off will decrease. I think that the time taken for a volume of gas to be given off will decrease as I decrease the acid concentration:
Plan:
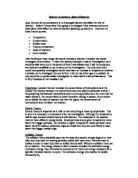
We decided to use the speed at which the reaction produced 100Cm3 of gas with different concentrations of acid for our experement. The setup we were going to use was fairly simple and we had used it before for previous experiments. Pictured below is the setup:
The gas travels through the delivery tube into the measuring cylinder, which is filled with water, as the gas fills the cylinder its volume can be measured.
Method:
For our variables we used: Concentration of acid (independent variable), Weight of marble chips (controlled variable), Speed at which the reaction produces 100ml of Co2 ( dependant variable).We made sure we were wearing safety goggles (because we were working with strong acid). To make measuring the concentration of the acid easier we decided to use 100 ml of acid as 100% concentration, therefore 90 ml of acid and 10 ml of distilled water would mean the acid was at 90% concentration. We decided we would see how long it took different concentrations of hydrochloric acid to form 100 ml of carbon dioxide gas with 20 g of marble chips. To make sure our experiment was a fair test we used exactly equal amounts of marble for each test, and repeated each test three times to make sure we got non-biased results.
Results:
The results collected from the three experiments are shown in a table below:
I have also added a graph to show these results. This helped me identify a graphical pattern.
Analysis:
From my results I can see that the time taken to collect 100Cm3 of CO2 decreases as the concentration of the acid increases. This is also shown in my graph which shows the results, although the curve of the graph appears smooth in the line of best fit. From the actual results the patteren is not as obvious although there is a difference of about three seconds between each concentration e.g. at 10% acid concentration the rate of 100Cm3 gas production is 75 seconds and at 20% concentration of is 66 seconds, this is a difference of 9 seconds. At 30% concentration the rate (Cm3 per second) of 100Cm3 gas production of 60 seconds, a difference of 6 seconds compared to 20% concentration and finally at 40% concentration the time taken for the gas to be produced is 58 seconds which is 2 seconds difference from the last concentration. This pattern continues until about 20-25% when the curve begins to flatten out.
I think the general pattern is due to the collision theory, which states that if you increase the concentration of a solution there will be more collisions between the reactants for the simple reason that there will be more particles of the solution to collide/react with thus increasing the chance of collision.
Therefore I conclude that I have proved my origional hypothesis and I can state that as you decrease the concentration of the amount of gas evolved decreases as the reaction is happening slower.
Evaluation:
I think that this experimental procedure was useful to demonstrate my original prediction. It worked very well and I was pleased with the set of results I obtained. This is because they showed clearly the change in reaction rates dependant upon the concentration of acid.
I do think that the results were accurate because I did everything three times and there were no truly anomalous results meaning that the reaction was the same each time I carried it out. The shape of the graph was smooth enough for me to state that it showed a good change in the rate of reaction.
To improve this experiment I would record the time taken to produce each Cm3 of gas rather than just the time taken to produce 100Cm3. This would allow me to see the rate of reaction much more clearly.Shown below is an estimated table of results of the time taken to produce 10Cm3 of gas