Rates of Reaction
Aim
For the cause of this venture I will be performing an experiment within which my aim will be to determine the effect, concentration has on the rate of reaction. I will be undertaking an intense study between hydrochloric acid and sodium thiosulphate.
sodium + hydrochloric sodium + sulphur + sulphur + water
thiosulphate acid chloride dioxide
Na2S2O3(aq) + 2HCl(aq) 2NaCl(aq) + S(s) + SO2(g) + H 2O(l)
The rate of reaction is the speed at which a reaction takes place. It is the rate of loss or formation of a product during a chemical reaction. In this case the rate of reaction will be measured upon the speed at which the solid sulphur is formed and thus the colourless solution goes cloudy.
Prediction
For a given reaction to take place, particles must collide with each other hard enough for a reaction to take place. However not all collisions result in a reaction, this is due to the energy barrier they must overcome. Only particles with enough energy to overcome that barrier will result in a reaction having collided with neighbouring particles. The energy contained by the particles is known as the 'activation energy'. This activation energy differs for each reaction.
Furthermore, there are four main factors which influence the rate of a reaction. These four factors are the following:
* Catalyst
* Concentration
* Surface area
* Temperature
Catalyst
A catalyst is something which reduces the activation energy, therefore the rate of reaction increases. Thus a catalyst can be defined as something which increases the rate of reaction. A catalyst is never used up; it just simply decreases the activation energy required for the reaction to take place. Hence the reaction occurs much quicker and the rate of reaction is increased.
A lot of chemical reactions are very slow; they have a slow rate of reaction. In such cases or in any other cases catalysts can be used to speed up reactions. A good example of where catalysts are very commonly used is in factories indulging in chemical reactions. Newer modernising car industries use catalyst in the form of platinum, they are inserted in the exhausts of cars and their job is to quickly turn poisonous gases into less harmful ones so that when the gases are released into the atmosphere they do not add to the greenhouse effect. This type of catalyst found in exhausts is known as Catalytic Converters. To speed up a reaction, very minute amounts of catalysts are needed.
Some chemical reactions which are slow can sometimes be useful. For example a car rusting is a very slow process, this is good because then the car will last for much longer.
Concentration
Concentration be explained using the collision theory. Reactants are made up of molecules of atoms which move around freely in a solution or a gas. These must collide hard enough (activation energy) for a reaction to take place. If you increase the concentration of one or both of the reactants there are more particles, hence a greater chance of particle's colliding and a reaction taking place. This is why an increase in the concentration results in an increase in the rate of reaction.
Surface Area
Once again surface area can also be explained by using the collision theory. If the surface of an object increases, then the number of particles of that object also increase. If there are more particles within the reaction then there is a much greater chance of the particles colliding with one another and also a much greater chance of a reaction taking place. This is why an increase of surface area results in an enhancement of a quicker rate of reaction.
Temperature
For a reaction to take place, the particles of the reactants have to collide with each other (collision theory). The particles of the reactants will only collide with one another if there is enough activation energy. By increasing the temperature we are also increasing the activation energy. By this we mean that the particles move around much faster, and consequently the probability of the particles colliding with each other increases by massive and so does the rate of reaction. This is sometimes known as the kinetic theory.
However, from the above four factors that I have mentioned I will be choosing 'Concentration' as an independent and continuous variable for this particular experiment. My prediction is that as the concentration of hydrochloric acid is increased so will the rate of reaction. I will be increasing the concentration of hydrochloric acid rather than sodium thiosulphate because; by looking at the equation that I mentioned in my aim, it becomes apparent that for every one element of sodium thiosulphate that is added, you need to add two elements of hydrochloric acid. Thus by increasing the hydrochloric acid there will be a much greater affect upon the reaction rather than if one was to increase the accumulation of sodium thiosulphate.
Hence, my prediction for the outcome of the experiment is; that as the concentration of HCl is increased, the time taken for the reaction to take place decreases. I am basing my prediction upon the collision theory; clearly if there are more particles then more collisions will take place, and more bonds will be formed/ broken, increasing the rate of reaction. However, I also predict that eventually the rate of reaction will stop increasing regardless of how much I increase the concentration of HCl, this is due to the limited sodium thiosulphate particles that will limit the overall reaction. Hence, there will be too many particles of HCl for the particles of sodium thiosulphate to collide with. As a result of this the higher concentrations will become alike. I also predict that eventually the reaction will be limited to how slow it can react due to the low number of particles of HCl.
Having obtained my results and tabulated my results, I will record my results on a graph. My prediction is that by plotting the results on a graph; the graph will show a fast reaction when the concentration of HCl is large, however it will be limited to haw fast it can react. I say this because; there are only so many particles of sodium thiosulphate for the HCl particles to react with. Therefore I predict that eventually a straight line will form from the top side. The rate of reaction will then slowly curve off as the concentration ...
This is a preview of the whole essay
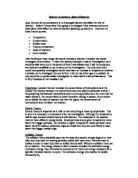
Having obtained my results and tabulated my results, I will record my results on a graph. My prediction is that by plotting the results on a graph; the graph will show a fast reaction when the concentration of HCl is large, however it will be limited to haw fast it can react. I say this because; there are only so many particles of sodium thiosulphate for the HCl particles to react with. Therefore I predict that eventually a straight line will form from the top side. The rate of reaction will then slowly curve off as the concentration begins to decrease causing the reaction to become slower and slower. Then I predict that eventually the graph will straighten off again but this time from the bottom, due to the low concentration of HCl; there are only a small number of particles of HCl for the sodium thiosulpahte to collide with. Therefore I predict the graph will show a curve being straightened off from both sides. The graph I am predicting should look similar to the one below:
Apparatus
To carry out this experiment I will need following pieces of equipment:
* Bench mat - used to prevent spillages onto bench
* Goggles - used to ensure chemicals do not make contact with the eyes
* Stop-watch - used to measure time taken for reaction to take place
* Squared paper - to draw graph of results on
* Weighing scale - to measure the weight of the sodium thiosulphate
* Teat pipette - used to accurately add drops of reactants to the measuring cylinder to make up to the required volume.
* 250ml conical flask - the conical flask is where the reactants will be placed for the reaction to take place.
* 10ml measuring cylinder - used to measure small volumes accurately.
* 50ml measuring cylinder - used to measure the bigger volumes accurately.
* Solid sodium thiosulphate crystals - Provided by the teacher and used to dissolve and make the required concentration and volume of sodium thiosulphate solution.
* 1M HCl - an accurate 1M HCl solution was provided by the teacher that was used to dilute down to make the required concentrations and volumes of HCl.
Variables
The independent variable will be the change in the concentration of HCl. The dependent variable is going to be what I will measure, in this case the rate of reaction or the rate the cross disappears due to the precipitation of sulphur. There are some constant variables, these are as follows:
* The volume of hydrochloric acid
* The volume of sodium thiosulphate
* Temperature of hydrochloric acid
* Temperature of sodium thiosulphate
* The size and colour of cross used to observe the cloudiness of the mixture.
* Types of apparatus used
* Person looking at mixture from a bird's eye view and the height he looks at it from
By keeping these variables the same it will help the experiment remain fair throughout. By changing any one of these variables the rate of reaction could be affected, for example: if we were to change the size of the cross after the experiment is done once; the time measured will differ not only because of the concentration of hydrochloric acid but also because of the different size of cross. If this was to happen the test would become unfair.
Preliminary
I will now go on to explaining how we prepared for the experiment; how we made up the reactants. Firstly we had to decide the concentration level of the sodium thiosulphate. Thus we tested 50 ml of 5g/l solution of sodium thiosulphate with 20ml of 1.0M of HCl and found it took too long; 621 seconds to be exact. This meant that the overall reaction would take way too long, especially when the concentration of HCl was decreased. Therefore we tried a more concentrated solution of sodium thiosulphate - 25g/l; we did this to speed the reaction up. The reaction did speed up and did not take as long in comparison to the prior attempt. So we decided that 25g/l of sodium thiosulphate, was a better concentration to use.
I will now go on to talking about how we actually diluted the sodium thiosulphate, how we made it less and more concentrated, diluted it and made into a liquid solution. We weighed out 25.0g of sodium thiosulphate crystals and dissolved it in litre of water. By doing this we had a concentrated liquid solution of 25g/l of sodium thiosulphate.
Having made the sodium thiosulphate we now had to dilute the second reactant; hydrochloric acid. We had to make this at different concentration levels as the factor that we would be changing in the experiment was the concentration levels of hydrochloric acid. Below is a table showing the different diluted concentrated solutions of hydrochloric acid which explains how much water I added each time to give me the different concentration levels I needed.
Concentration of HCl needed
Volume of 1M HCl added (ml)
Volume of water added (ml)
Total volume of solution made (ml)
0.1
25
225
250
0.2
50
200
250
0.3
75
75
250
0.4
00
50
250
0.5
25
25
250
0.6
50
00
250
0.7
75
75
250
0.8
200
50
250
0.9
225
25
250
The reason why we made the overall diluted solution at a higher volume of 250ml was because this reduces the percentage of error and not only makes the solution more accurate but makes the overall experiment more accurate. For example; if we were to make the solution at 25ml rather that 250ml, when measuring to the closest ml if we measured 1ml out of place; this would cause an error of 4% - 1/25. However if the same error was to be made within a solution of 250ml; the error would only be recorded as 0.4% - 1/250. As you can see the ratio is reduced, and the accuracy is increased.
From the preliminary we also realised at what specific point we needed to stop timing. We knew we had to stop timing when the 'X' was covered by the precipitation of sulphur and the solution became one colour and the cross could no longer be seen. This acted as our bench mark.
Method
Having made the solution I will now talk about how we did the actual experiment. Firstly we cut out a short piece of paper (larger than the base of the conical flask), and we drew a cross on it using a black marker. We then measured out 50ml of 25g/l sodium thiosulphate into a 250ml conical flask. Then we measured 20ml of 0.1M HCl into the same conical flask and began timing. When the person watching the beaker from a bird's eye view saw that the cross had 'disappeared' we stopped timing. We repeated the same experiment with the same concentration level three times and recorded the times into a table and obtained an average. By obtaining an average we improved the accuracy and credibility of the findings, and helped us to present reliable and solid justifications for the final conclusions. The repeated results and the averages helped us to flatten out any anomalies. Occasionally we did see a very odd results that did not compare well with the other results, we discarded these and repeated the readings to make sure the results remained precise. The average is what we recorded on the graph. We repeated the above for all the different concentration levels of HCl, as listed in the table above.
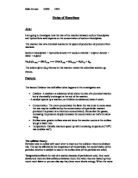
Below is a small diagram explaining how we measured the rate of reaction:
Look at cross through solution
Timing how long it takes for the cross to disappear can be used to measure the rate of reaction; the lengthier the time, the slower the rate of reaction. The shorter the time, the quicker the rate of reaction. We will know approximately when the reaction has taken place; when the solution has become cloudy and the cross can no longer be seen:
Results
Below is a table showing the results we obtained from the experiment:
Concentration of HCl (M)
Take 1 (seconds)
Take 2 (seconds)
Take 3 (seconds)
Average time (seconds) 2.d.p
0.1
40
45
47
44.00
0.2
71
15
13
99.67
0.3
99
04
01
01.33
0.4
87
92
90
89.67
0.5
82
86
85
84.33
0.6
80
78
78
78.67
0.7
75
77
76
76.00
0.8
70
73
74
72.33
0.9
69
70
72
70.33
69
70
70
69.67
Below is a graph with the above results plotted upon. The x-axis represents the time taken for the reaction, and the y-axis represent the varying concentrations of HCl.
I have also hand-drawn the above graph on graph paper; this allows me to draw a much smoother curve.
As can be seen from the above graph we did obtain an anomaly that does not fit in with the line of best curve, which I have circled. The only reason I could possibly think of as to why I obtained this anomaly is because we made a mistake somewhere when diluting down the concentration of HCl to 0.2M. Looking at 'Take 1' from the results table for 0.2M HCl (71 seconds), it does not contrast well with the other takes for 0.2M HCl (115, 113). There is clearly a substantial amount of difference. Also looking at the results table, the time taken in 'Take 1' when the concentration of HCl is at 0.2M, is very similar to the time taken when the concentration of HCl is at 0.8M;
0.8M HCl (first take) = 70 seconds 0.2MHCl (first take) = 71 seconds
On the basis of this evidence, I believe we diluted the HCl down to 0.8M instead of diluting it down to 0.2M in the first take. Also the first take for 0.2M HCl does not contrast well with the other takes for 0.2M HCl. Thus we repeated the first take for 0.2M HCl, obtained a new average for 0.2M HCl and drew up a new results table:
Concentration of HCl (M)
Take 1 (seconds)
Take 2 (seconds)
Take 3 (seconds)
Average time (seconds) 2.d.p
0.1
40
45
47
44.00
0.2
20
15
13
16.00
0.3
99
04
01
01.33
0.4
87
92
90
89.67
0.5
82
86
85
84.33
0.6
80
78
78
78.67
0.7
75
77
76
76.00
0.8
70
73
74
72.33
0.9
69
70
72
70.33
69
70
70
69.67
Below is a graph showing my new set of results above:
I have also hand draw the above graph that will be inserted with this report; this is so a smoother curve may be drawn. I will now use the above graph as my final graph.
Analysis
I have plotted the average obtained for each concentration on a graph as can be seen above on my final graph, Graph B. There is a clear indication that the reaction is slow when the concentration of HCl is low and the reaction is quicker when the concentration of HCl is higher. The rate of reaction slowly curves off as the concentration of HCl increases. Towards the final few dilutions of higher concentrations (0.8M - 1M) you can see that the reaction time increases until it nearly becomes constant; the readings become very similar. The reading for 0.9M of HCl was 70.33 and the reading for 1M of HCl was 69.67. As can be seen they are very similar and the difference between the two readings is only 0.66: 70.33 - 69.67 = 0.66.
This begins to show that regardless of how concentrated the HCl is the reaction is now limited to the other reactant, the sodium thiosulphate. By this I mean; that initially as the concentration of HCl was increased, the rate of reaction also increased. However, it came to a point, that no matter how much you increased the concentration of HCl by, the reaction was limited due to the concentration of the weaker solution, sodium thiosulphate. This is because there are just simply not enough particles in the weaker solution (sodium thiosulphate) compared to the stronger solution (HCl). The reason behind this is because there are a certain number of particles of sodium thiosulphate and due to this limitation they can only react with a certain number of HCl particles. Once this collision limit has been reached, any excess HCl particles have no 'vacant' sodium thiosulphate particles to collide and react with. To increase the rate of reaction at this stage, I would obviously have to increase the concentration of sodium thiosulphate. Consequently, as a result of this, the graph slowly began to show a straight line; constant results, at the top of the line in the graph:
I am sure had I carried out the reaction on to about 2M HCl solution the graph would have straightened out.
It can also be proven on the graph that a straight line is not only starting to appear at the top end of the graph but is also starting to appear on the bottom end of the graph.
The line can be somewhat be seen but it can definitely be predicted due to the placement of the results towards the bottom end of the graph; they are definitely heading towards a straight line.
This straight line is starting to appear at the bottom of the graph, due to the low concentrations of the HCl. My results show; the reading for 0.2M of HCl is 118.33 and the reading for 0.1M of HCl is 144.00. Although there is still a substantial amount of difference between the two readings, I can say that a line is starting to appear using my own knowledge and the appearance of the graph so far. The concentrations of HCl are very low compared to the particles of sodium thiosulpahte. It can be seen that inevitably, the reaction time at lower concentrations of HCl begin to show a second limit on the graph as I had predicted. This is similar to my theory before but in this case the particles of HCl are so small in number that the reaction becomes slower and slower until it would not be visible anymore i.e.: the cross would not disappear. This is due to the less concentrated, weaker solution - sodium thiosulphate.
Thus, one can clearly see from the results and the graph; that as concentration of the HCl increases, the rate of reaction also increases. This is due to the increase of particles per unit volume, which results in increase of collisions between particles.
Overall, from my experiment I have managed to determine that the higher the concentration of the HCl the faster the rate of reaction.
The results obtained and the graph above, clearly support my prediction. I had predicted that as the concentration of the HCl increased the rate of reaction would also increase. This has been proven in my results and graph. I had also predicted that eventually the results would become constant and begin to show a straight line at both ends of the graph, this is also proven above. The graph I had predicted and drawn in my prediction is very similar to the graph I have acquired. All these points prove that my predictions were correct.
Evaluation
I believe that overall my experiment was quite successful. I have managed to create a graph which clearly supports my prediction and views regarding the collision theory. At one points we did obtain an anomaly, for example referring back to the results table on page 7; in 'Take 1' when the concentration of HCl was 0.2M, on the first attempt we got the result as 71. This looked very odd next to the other two takes for this concentration of HCl and also when I drew a graph for these set of results, this anomaly could be clearly seen as the average for 0.2M HCl did not fit in with the line of best curve on 'Graph A' So we repeated the attempt and managed to get 120. We were happy with this and decided to keep this result. We also drew a graph and this time the average for 0.2M HCl did fit in well with the line of best curve. I believe that we got this anomalous result in the first place because we did not dilute the HCl down enough. For any other anomalies, we did the same; we discarded them and repeated the reaction. Hence, I am pleased to say that there are not any anomalies to be spotted on my final graph (Graph B) and it shows a good line of best curve. Also my graph shows and proves that as the concentration of HCl is increased the rate of reaction also increases.
I believe I have been successful in my work. I have managed to established via a graph that; the rate of reaction increases as the concentration of HCl increases, however the rate of reaction is limited to exactly how slow and fast it can react.
It can also be seen from the graph that the rate of reaction extended, towards the lower concentrations of HCl, much more than the other reactions recorded on the graph. The final 3 reactions took a lot longer than the others previous. From 0.4M concentration of HCl up to 0.1M HCl, the reactions took much longer than the others. I believe this is because the reaction took so long that it was hard to decide when the cross could no longer be seen. This is another thing that promotes the fact that my method used was not completely accurate.
I also believe that my investigation was carried out properly. I used all the required equipment and used it in a professional manner. I set all the apparatus' out very well. I met all the safety requirements and avoided any mishaps, such as spillages, breakages, unwanted reactions. The measurements of the HCl and sodium thiosulphate were very accurate.
Some of my results varied a lot more than I would have preferred. Take for example, 0.1M HCl concentration range was from 140-147 seconds. That range shows a lack of precision.
I believe that I could have improved my experiment overall in a number of ways. One of them being the method used to undertake the experiment. I believe that I could have improved the experiment by using a much more accurate, detailed and thorough method. As the method used was not completely accurate and precise. It could be argued that it is quite hard to tell what the exact time is when the cross has actually 'disappeared' and can no longer be seen. For example, a better method for measuring the rate of reaction could have been trapping the S0 2 gas given off from the reaction, in a measuring cylinder. I could have collected the gas in a water filled measuring cylinder. The gas would have pushed the water upwards, making it easy to measure the volume of the gas. This method is known as sometimes known as 'Volume of gas given off', and below is a diagram explaining how this method would work if it was to be used:
However, due to the lack of facilities I was unable to do this. But I am sure, having used this method, the results obtained would have been much more precise and the experiment as a whole would have improved and been much more accurate.
As the method used was not completely accurate and precise. It could be argued that it is quite hard to tell what the exact time is when the cross has actually 'disappeared' and can no longer be seen.
If I was to repeat the experiment, I would almost defiantly use a different method which is more accurate and precise. I could possibly change the factor tested to determine the rate of reaction. I could choose; catalyst, temperature, surface area, etc. I would most likely choose temperature as I understand this much better in comparison to the other factors and this involves the kinetic theory, which I find quite interesting. The temperature affects the speed of the rate of the reaction, as it increases or decreases the kinetic energy. By doing this it affects the speed at which a reaction takes place. If the temperature is increased, then the kinetic energy is also increased, which results in a quicker reaction. However, if the temperature is decreased, then the kinetic energy is also decreased, which alternatively results in a slower rate of reaction. Below is a diagram explaining how this method would take place:
For this investigation I would insert both reactants into the sealed conical flask and observe the final reading on the syringe starting from 0. I would record the amount of gas given off are certain intervals and work out the initial rate of reaction by reading of the graph that I have inserted with the diagram setup.
Another factor I could change if I was to repeat the experiment, could be the concentration of the sodium thiosulphate and also the start and end concentrations of the HCl. I would also definitely carry out the experiment to 2M HCl rather than ending it at 1.0M. By doing this the straight could clearly be visible on the graph and my prediction could be backed up a lot more. I could have also gone up in 0.05M HCl rather than 0.1M HCl.
I could also use a burette or an accurate pipette to measure the solutions, if the experiment was to be repeated.. By doing this the accuracy of the experiment would have been improved by a great deal.
I believe I did have some experimental errors. For example referring back to the table on page 6, picking an example; when the concentration of HCl is 0.1M, the range between 'Take 1' and 'Take 3' is 7 (147 - 140). The highest fluctuation value is 140 from the average 144; 4/144 = 2.78%. So an idea of the experimental error as a percentage is 2.78%.
Concentration of HCl (M)
Take 1 (seconds)
Take 2 (seconds)
Take 3 (seconds)
Average time (seconds)
0.1
40
45
47
44
This is not too bad, considering that the experiment was done in a very basic laboratory.
Conclusively, I have managed to produce a curve on the graph and the points did fall on the curve. This shows that my results were fairly precise.