Concentration: If one of the reactants involves using an acidic or basic solution to trigger the reaction, you could vary its concentration by diluting it with distilled water to give weaker concentrations, which is usually done to a certain ratio. For example, if you start with a 3M concentration of hydrochloric acid, you could introduce a ratio that would produce the same volume of acid of 2.4M, 1.8M, 1.2M, and 0.6M solutions. This ratio easily allows the performer of the experiment to compare the effects of the different strengths of acids, by direct analysis, or by graphing and/or tabulation.
Surface Area: If you were using a solid such as a metal in a reaction, varying the surface area would be another way of getting more results for analysis. For example, if you were using 2 grams of magnesium ribbon, you could acquire the same mass of magnesium but in a powdered form or even in a lump or chip form. This can either speed up, or slow down the reaction, depending on the strength of the reaction. Sometimes varying the surface area could produce very different results to what you had previously hypothesised and/or recorded.
Temperature: Sometimes reactants will behave differently when their particles are accelerated or decelerated by a difference in the temperature that it is exposed to. Collision theory says that the faster the molecules in a reaction are moving and the more energy is created, the faster the rate of change will be. Generally speaking, as you increase the temperature in a reaction, the molecules move faster and faster, which could eventually lower the reaction rate. Generally speaking, the colder the temperature, the slower the particles move and the slower the reaction rate will be, and vice versa. However, this assumption cannot be made for every reaction, as sometimes a very large temperature change has to occur for the reaction rate to change even just a small bit, and the rates can be out of proportion too.
Catalysts: Catalysts are generally used in extremely slow reactions to increase the speed of the reaction in order to gain quicker results. For example, the conversion of hydrogen peroxide (H2O2) to water and oxygen (H2O + O2) takes several days, but can be sped up by introducing a sample of liver, a pinch of manganese dioxide (MnO2) or a biological enzyme such as potato extract. Enzymes that are used in a biological reaction are called substrates. Substrates are not used very often in chemistry. Different catalysts generally cause the reaction to speed up at different rates, so to gain results from a slow reaction such as this, the catalysts have to be compared, usually by comparing the different times of reaction for each of them.
Experimental Procedure
To help understand reaction rate a little better, experiments were set up to test the different factors that affect rate of reaction and how different reactants produce different results.
Experiment 1. - The first experiment involved a reaction between Hydrochloric Acid (HCl) and Magnesium Ribbon (Mg). The experiment was performed in a 100ml beaker and the results were timed on a stopwatch. The only variable that was measured in this experiment was the concentration of the hydrochloric acid. The first sample of hydrochloric was a 2M solution, so the solution was diluted into a ratio that gave 4 different concentrations of hydrochloric acid, which were: 2M, 1.5M, 1M and 0.5M solutions. The ratios are provided in the below table:
The time it took to complete the reaction was measured rather than the volume of gas produced over time, because the reaction happened too fast to record any trustworthy information about the gas, and there was no other realistic way to record any other rate of reaction.
Prediction – The higher the concentration of the HCl, the quicker the reaction will be and the higher the reaction rate.
Experiment 2. - The second experiment involved a reaction between Zinc metal (Zn) and a solution of Sulphuric Acid (SO4). A “pop test” was performed to confirm suspicions of a presence of hydrogen gas as one of the products in the reaction. This involved sticking a burning splint over the end of a test tube with the reaction taking place. If a popping sound is heard, it means that the gas being produced is hydrogen. To measure the reaction rate in this experiment, a tub of water was set up and a measuring cylinder was filled to the top with water, and turned upside-down and placed into the tub of water, so that the volume of gas produced in the reaction could be measured in the cylinder. The reactants were placed into a sealed bottle that had only one exit, a tube that extended out the top. This tube was hooked under the cylinder so that the gas would run through the tube and go into the cylinder to be measured. Three different concentrations were made which included:
This reaction was slow, so the reaction rate was recorded by measuring the amount of gas produced per minute, rather than the time taken for the reaction to complete, as that could have taken hours or even days.
Another experiment was performed using the same reactants, but the surface area of the zinc was varied instead. Both zinc powder and zinc chips were used in the reaction. Once again, the volume of gas per minute was recorded. The 3M concentration of acid was used, as it would produce better, faster results than any other.
Prediction – Once again, the higher the concentration of SO4, the quicker the time of reaction will be, and the higher the rate of reaction.
The higher the surface area, the slower the time will be and the lower the rate of reaction will be.
Experiment 3. - The third experiment involved testing different strengths of iodine diluted with water, in an aqueous mixture of 20ml Persulfate (S2O8-2) and 10ml Thiosulfate (S2O3-2). Starch was used to indicate when the reaction was occurring. The reaction took place in a 100mL beaker, on a sheet of white paper, to allow us to clearly see the colour change to blue. The starch and persulfate/thiosulfate solution were put into the beaker first, then the iodine when the clock was ready. The table of the different ratios for concentration is provided in the table below:
The time was obviously recorded for this experiment, as there was no detectable gas produced and there was no other reasonable way of recording rate of reaction.
Another experiment took place involving exactly the same reactants as used previously in the persulfate prac. This time the temperature was varied. The lowest concentration of iodine to water was used, as it was hypothesised that a higher temperature would make the reaction go much faster, and that a cooler temperature would reduce the reaction speed. Four different temperatures were used in this wing of the experiment, which were: 7.4°C, 14.8°C, 26°C and 60°C. The 100mL beaker containing the reactants was partially submerged into a larger beaker of water heated to the given temperatures. Once again the time was recorded for the colour change.
Prediction – The more Iodide involved in the reaction, the quicker the colour change will be and the higher the rate of reaction will be.
The higher the temperature, the quicker the time will be and the higher the rate of reaction will be.
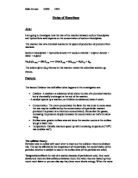
Experiment 4. – The fourth experiment involved testing the decomposition of hydrogen peroxide (H2O2). The hydrogen peroxide itself, reacts when in contact with the air, however the reaction is a slow process. Therefore this experiment had to be aimed at catalysing the reaction, to get faster results. Due to lack of materials, only one test could be carried out, and it ironically didn’t involve the testing of a catalyst. This test involved testing the gas produced by the reaction, to determine its composition. The results analysis sector of this report will hypothesise what would have been expected to happen, as well as justify its decision.
Prediction – Without any knowledge of the effects of the different catalysts, it is almost impossible to predict what will happen in the experiment.
Results
Experiment 1. – This experiment involved the testing of the concentration of hydrochloric acid in a reaction, which involved HCl and Mg.
Experiment 2. – This experiment involved the testing of (a) the concentration of sulphuric acid (b) the surface area of zinc and (c) the gas produced in an experiment, which involved dissolving zinc into a solution on sulphuric acid.
Concentration
Surface Area
“Pop Test” – confirmed the presence of hydrogen gas in the reaction.
Experiment 3. – This experiment involved testing the concentration of iodide as well as the different reaction times for different temperatures in a reaction involving iodide reacting with sodium thiosulfate and persulfate.
Concentration
Temperatures
Experiment 4. – The only result that could be recorded was the results of the gas analysis, which turned out to be positive for oxygen (O2).
Results Analysis
Experiment 1. – The hypothesis/prediction for this experiment was proven to be correct, as the rate of reaction was higher for higher concentrations of hydrochloric acid (HCl). The Concentration vs. Time and the Concentration vs. Reaction Rate information can be plotted on graphs such as the ones below:
These graphs clearly show that as you increase the concentration of HCl, the time of reaction goes down and the reaction rate goes up. By looking at these two graphs it becomes apparent that there is a 2nd order of reaction in relation to the concentration of hydrochloric acid. This is because there is a curved line that increases exponentially as concentration is increased.
Experiment 2. – The prediction for this experiment was that the higher the concentration of the acid (SO4), the lower the time would be and the higher the rate of reaction for gas/time would be. This prediction is at least half-correct. The reaction took too long to measure time, so volume was calculated for gas produced. As the concentration of the acid increased, more gas was being produced per second than lower concentrations. This information can be seen below:
By looking at these two graphs, it becomes obvious that there is a 1st order of reaction in relation to the concentration of SO4, as there is a straight line with a constant gradient.
A second experiment was also performed that varied the surface area, rather than the concentration. Three different surface areas were tested, with the prediction that as surface area increased, the time would increase and there would be a lower reaction rate. The information obtained in the experiments is graphed below:
By studying the two above graphs, you would estimate the order of reaction to be in between 1 and 2, closer to 1 than 2 though. This is evident by the short curve at the start, then a constant, straight gradient extending up at a constant rate. The only problem with this information is that the strips, chips and powder represented on the graph would not be in the proper proportion as it would be if the actual metric surface area were calculated. This would be extremely hard to do however.
Experiment 3. – The prediction for this experiment was that as the concentration of iodide was increased, the reaction would occur quicker, and the reaction rate would be lower. This prediction was correct as the rate of reaction decreased when the concentration increased. This data can be seen below in the form of two graphs:
These two graphs clearly demonstrate that as you increase the concentration of the iodide, the time decreases, and the reaction rate increases. This means that the reaction rate is directly proportional to the concentration of the iodide, and the time for reaction to complete is inversly proportional to the concentration of the iodide.
Experiment 4. – If the hydorgen peroxide had been as available to us as anyone else, three catalyst experiments would have been performed. One involving liver (blood), one involving Mangenise Dioxide (MnO2) and one with Iron Sulfate (FeSO4). Without actually performing the experiments, it is impossible to begin to predict how the time of reaction would have been effected by the different catalysts. However, upon examination of other people’s experiments, it became evident that all of the catalysts used in each of the experiments sped up the reaction greatly, some to the point where it became impossible to even measure the volume of gas produced.
Conclusion
Overall, I feel that, apart from the hydrogen peroxide prac, the entire investigation was a success. Valid information was acquired and was successfully integrated into the analysis of the experiments. The subject of reaction rate was researched and experimented on as well as related topics such as the reaction equation, order of reaction, collision theory and activation energy. If I were to do this experiment again, these are just some of the things I would change:
- Make sure I use the right equipment
- Make sure the equipment is clean
- Do the experiments multiple times in order to gain more results so that there is less chance of using incorrect information
- Manage my time more wisely so that I could have time to analyse each experiment and detect faults and perhaps retry experiments
- Investigate every possible way of changing the experiment(s) to involve all factors contributing to reaction rate