For this experiment I have decided to investigate how altering the concentration of a solution affects the rate of the reaction.
Preliminary Experiment
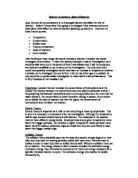
Before I did my final, proper experiment, I did a preliminary experiment to help to give myself an idea of what I was going to be doing in my proper experiment. For example, to help me to see what Molar (grams per litre) Solutions I was going to use and type of results that I was expecting in my proper experiment. For this preliminary experiment I have decided to test 6 different concentrations of sodium thiosulphate and see what effect this has on the rate of reaction. Below are my results:-
gpl = grams per litre
Graph for Preliminary Experiment
Planning
As for the plan of my final investigation, I am going to investigate to see the effects of concentration on the rate of reaction. From my preliminary experiment, I have decided how I am going to construct my final experiment.
I will be using 50cm3 of sodium thiosulphate always, not diluted by water to begin with. I will be adding 5cm3 of hydrochloric acid each time as a constant variable. The total volume of the contents in the conical flask will be 55cm3. The strength of the first experiment will be 40gpl. The experiment will be repeated two times for each concentration. The concentration of the sodium thiosulphate solution will go from 40gpl to begin with all the way down to 4gpl going down by 4gpl each time (40gpl, 36gpl, 32gpl, 28gpl……12gpl, 8gpl, and 4gpl). In order to weaken the strength of the concentration by 4gpl each time, 5cm3 of water needs to be added and 5cm3 of sodium thiosulphate removed each time.
The volume of hydrochloric acid must be kept constant at 5cm3 to keep the variable functional. If this constant is altered in any way it will affect the concentration of the sodium thiosulphate solution and make the results for that concentration invalid.
Different measuring cylinders should be used for each reactant so as not to mix them before the reaction has begun. The measuring cylinders should be accurate to the nearest 1cm3 partition.
A by-product of this reaction is sulphur gas which if left lying around can give off quite a strong smell. The contents of the conical flask will be split down the sink as soon as the reaction has taken place.
Aim
The aim of this experiment is to see the effect of altering the strengths of the concentrations of Sodium Thiosulphate solution on the rate of reaction.
Variables
- Volume of the reactants
- Temperature of the reactants
- Concentration of the reactants
- Adding a catalyst to speed up chemical reaction
- Surface Area of Conical Flask
Controls
- Constant Temperature
- Constant Volume/Concentration of Hydrochloric Acid
- Keep same piece of paper with ‘X’ on it all the way through the experiment
- Use same measuring cylinder for the same reactant each time
- Wash conical flask thoroughly after each experiment
Prediction
I predict that as the concentration of the sodium thiosulphate increases the rate of reaction will increase. The reason for this prediction is that when you increase the concentration of the sodium thiosulphate there will be more particles to react with the acid. This prediction can be related to the collision theory, where it states that effective collisions between reactant molecules must occur in order for the reaction to occur. An effective collision is when particles collide side by side, and not end-to-end or glance each other because these are ineffective and provide insufficient energy for a reaction to take place. There is also the same number of acid particles in each reaction so the reaction will take place quicker as the concentration of sodium thiosulphate increases and more particles are available for the reaction.
Diagram
Apparatus
-
750 cm3 of Sodium Thiosulphate Solution
-
600 cm3 of Water
-
150 cm3 of Hydrochloric Acid
- A Conical Flask
-
2 Measuring Cylinders (that measure accurately to 1cm3)
-
A Stopwatch (accurate to 1/100th of a second)
- A Piece of Paper and a Pen (the paper is where a large ‘X’ is drawn on)
Safety Points
- Make sure that you are wearing goggles to protect your eyes from accidental spills or splashes while making concentrations
- Make sure that you also wear a lab coat to prevent acid for getting on your clothes or from reacting with your skin
- The reaction between sodium thiosulphate and hydrochloric acid gives off sulphur gas which is poisonous, so after each reaction has finished quickly dispose of the conical flask’s contents down a sink and thoroughly clean the flask with water before starting another reaction
Method
- Gather and set up the equipment as shown in the above diagram
- On the piece of paper mark a large, bold ‘X’ on it so that when the conical flask is placed on top of it the ‘X’ can still just be seen around the sides
-
Pick up the two measuring cylinders. In one measuring cylinder, pour out 5cm3 of hydrochloric acid
-
Pour 50cm3 of sodium thiosulphate solution into the conical flask
-
Pour the 5cm3 of hydrochloric acid into the conical flask as well
- As soon as it is in start timing the reaction with a stopwatch
- Wait for the ‘X’ to completely disappear before you stop your stopwatch
- Clean the contents in the conical flask before you decide to repeat the experiment a further two times for that concentration (40gpl)
- Continue the experiment for 36gpl, then 32gpl, 28gpl…..8gpl and finally 4gpl
- Take two repeats for each reading
- Add water in another measuring cylinder for the rest of the experiment
-
Make sure the mixture of sodium thiosulphate solution and water adds up to 50cm3 each time
- When you complete the experiment, clear up your workspace
Fair Test Points
- Take two extra repeat readings for each concentration to ensure that the results are more accurate than if only one reading was taken. Then an average of the results for each concentration should be taken and only then a graph should be plotted.
- I will also carefully measure out the same amount of hydrochloric acid, sodium thiosulphate and water that I am adding to ensure that my results are as accurate as possible.
- After each result is recorded, I will thoroughly wash out the solution from the conical flask before I start to take my next results.
- I will also use the same piece of paper with the ‘X’ on it all the way through the experiment as different sized and bolder ‘X’ shapes will affect my results when it comes to seeing if the ‘X’ is no longer visible.
Results
Strength of Sodium Thiosulphate Solution = 40/50 * Amount of Sodium Thiosulphate Added
40gpl = 40/50 * 50
36gpl = 40/50 * 45
32gpl = 40/50 * 40
28gpl = 40/50 * 35
24gpl = 40/50 * 30
20gpl = 40/50 * 25
16gpl = 40/50 * 20
12gpl = 40/50 * 15
8gpl = 40/50 * 10
4gpl = 40/50 * 5
Graph
Graph
Analysis
The rate of reaction was studied by reacting sodium thiosulphate solution with dilute hydrochloric acid. In all experiments the temperature, concentration of acid, volume of acid and volume of sodium thiosulphate was kept constant. The only variable was the concentration of sodium thiosulphate.
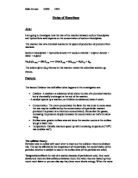
Each time 5cm3 more water was added to the salt solution making the total volume 50 cm3. The results were noted and the graphs have been drawn to see the effect of change on the concentration of the sodium thiosulphate on the rate of the reaction. In each case, an ‘X’ was drawn on the paper and the time taken for the disappearance of ‘X’ due to the production of sulphur in the reaction.
The graphs that I have drawn clearly indicate that when the concentration of water is high, it takes more time to complete the reaction and when the concentration of water is lower the reaction proceeds at a greater rate because the ‘X’ disappears quickly. Therefore, we can deduce that more concentration of sodium thiosulphate increases the rate of the reaction. This was stated in the prediction that I made before I began this experiment and is shown by my graphs and results tables. For example, sulphur appears faster and hides the ‘X’.
From the graph of average time taken against concentration of sodium thiosulphate, it can quite clearly be seen that I have managed to achieve an anomalous set of results for 20gpl. There are a number of possible reasons for why this error occurred and this includes:-
- The person that was seeing when the cross disappeared could have thought it disappeared slightly earlier or later than it actually did
- I noticed that some of the reactants had spilled on the outside of the conical flask and this had resulted in the ‘X’ getting smudged with the reactant. This could have possibly changed the time for when it was visible by shortening it
Conclusion
The collision theory supports my statement that increasing the concentration of thiosulphate means more collisions and so more sulphur is produced in less time. The collision theory states that there must be an effective collision between atoms, molecules or ions for a reaction to take place. The volume of the solution remained at 50cm3 so as the concentration of sodium thiosulphate increased; there were more particles to react with the acid in the same volume and this resulted in more collisions and a faster reaction.
The graph of reaction time against concentration of sodium thiosulphate produces a curve shaped graph of inverse proportionality. The other graph I have drawn for inverse time against concentration of sodium thiosulphate gives a straight lined graph with a positive correlation.
I found it difficult to see exactly when the ‘X’ was disappearing and I did not feel that despite taking two repeat recordings for each measurement my results were still not as accurate as they should have been.
For all of the experiments that I did, my prediction that as you increase the concentration of the sodium thiosulphate solution the rate of reaction will increase and therefore the time taken for the reaction to occur will become lesser and lesser, was true.
Evaluation
As far as the results of my experiment are concerned, I find them satisfactory and generally my experiments were successful with the exception of a few anomalous results.
From my results and graphs it is evident that they go along with the prediction I made at the beginning before I performed my experiment and that is more concentration of thiosulphate added each time.
I repeated the experiment twice with the same measurements and I took the average of my results for each concentration to draw up my results table and my graphs. Generally it was found that my results were similar in all three readings. Repetition of the experiment with the same readings has provided enough proof about the correction and accuracy of the values obtained.
I could have improved my results by adopting the following measures:-
- The measurement of volume of acid can be done accurately by drawing the measuring cylinder before use and also by using a white paper to place behind the cylinder to see the exact position of the miniscus
- The volume of water which was added each time to the thiosulphate solution could have also been measured more accurately by using more accurately marked cylinders that are easy to read off
- The result could also be improved by focussing my eyes constantly on the process of disappearance of ‘X’. There should be no need to divert my attention from left to right even once
The results can be more accurately judged by using different volumes of water and sodium thiosulphate solution, for example, 2, 4, 6, 8 cm3 of water instead of 5, 10, 15, 20cm3. The results expected should still have the same pattern if the same concentrations of sodium thiosulphate solution are used. This will give us another set of readings of which more graphs can be drawn to investigate the rate of reaction.
As for further experiments, the rate of reaction in this case can also be studied by changing the concentration of acid or even by keeping both concentrations the same but by changing the temperature each time. It can be investigated how this would affect the rate of the reaction. I would also have liked to continue the investigation on concentration below 4gpl and see what exactly would happen to the results if they were drawn on a graph.