These results have showed me approximately how long it will take to for at least two rates of reaction. As the doubling effect didn’t take place I will not be looking for it in my real table of results. I now understand how the rate of reaction occurs. This has been very helpful to my plan. Now I know that I don’t need to change the amount of concentration that I was planning for because these concentrations support my hypothesis, though I will still increase the variety of concentrations from 0.50M to 2.00M.
Fairness control
In the test I must have a great level of fairness and equality to keep my results as accurate as possible:
a) Washing of all equipment used to contain the variables (measuring cylinder and test tubes). If this wasn’t done the concentration of the acid wouldn’t be accurate and that would definitely have an impact on my results.
b) Measuring of both variables must be kept the same in each trial in mass or volume. The magnesium ribbon must be measured and cut to 15mm each time, and the hydrochloric acid must be measured to 5cm³ each time. If this wasn’t done the test would many anomalies.
c) Do not include other factors than the one planned for which is change of concentration. Factors such as temperature can speed up the reaction by giving the particles more speed and more energy to collide. So it is important that the room temperature remains the same while I carry out the experiments.
Pressure also affect rate of reaction by giving particles less space to move freely and allow more collisions to happen. This means that I must always keep the test tubes the same size while reaction occurring.
d) Record all results in the same units (seconds), so that it will be easier to plot the points on the scatter graph.
e) Do each concentration twice, to calculate the average and to find out there are any abnormal results from the first or second trial, if there is do a third trial to find the incorrect abnormality, and cancel it out.
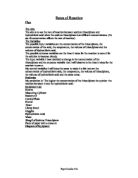
Apparatus used in experiment:
- 1 Measuring cylinder
- 1 stop clock
- 1 pipette
- 6x2 strips of magnesium ribbon (15mm)
- 1 test tube rack
- 3 test tubes
- 6 different concentrations of 2HCl: (0.50, 0.75, 1.00, 1.50, 1.75, and 2.00)
Method in steps:
- Collect all apparatuses and variables needed for experiments, and check that everything is there.
- Measure variables to correct length or volume and units. Cut the 12 strips of magnesium ribbons to correct length (15mm). Measure each concentration in measuring cylinder to 5cm³, by using a pipette to extract 2HCl.
- Pour the measured 2HCl into test tubes.
- Put the Magnesium into the 2HCl tubes and time the time taken for the reaction to finish by using the stop clock.
- Convert time in minutes to seconds by multiplying by 60 and record results in the table. If the results are close the hundredth of a second make sure to round up or down e.g. 51.96=52 seconds.
- Cleanse measuring instruments and tubes and repeat the experiment 6 times because of the six different concentrations and each trial twice to calculate an average and to see are the same repeated twice.
Safety
- Always wear goggles
- Only do experiments when teachers are present
- Wear shoes rather than sandals or any other skin revealing footwear
- Avoid skin contact with acid
- Wash hands before leaving laboratory
- Never taste laboratory materials
- Clear table of all unnecessary objects such as clothes or bags
Obtaining Evidence
Rate of Reaction Recorded in Table
I have not repeated any of the results because they were all fairly close to each other.
I will now plot the trial averages on a scatter graph. I will draw scatter graph because I believe it will represent my results in a decent manner and show if I have any anomalous results.
The Y-axis will state the rate of reaction in seconds from 0s to 3000s and the X-axis will state the concentration from 0.00M to 2.00M.
Analysis
See bigger graph
next page →
Rates of Reaction Averages Graph
Conclusion
The results of my investigation support the prediction that I made.
My prediction was: The higher the concentration of the independent variable (hydrochloric acid), the quicker the speed will be for the dependant variable (magnesium ribbon) to make product (hydrogen).
I know this from the results in the table, and also the graph which clearly shows that as the concentration increases the time (Rate of Reaction) decreases.
This means that the high concentration makes the reaction quicker between the magnesium ribbon and hydrochloric acid.
I knew before the investigation that concentration is factor which can speed up a reaction, because I had done some research on the collision theory.
The collision theory is related with concentration due to the number of acid particles making it more frequent for the variables to collide and cause a reaction. It is called a theory because it is believed that particles collide with each other to make a reaction, but can’t be proven as a fact.
There is also another theory which is less credible but still might be true.
This theory suggests that the high concentration lowers the activation energy needed for a reaction to happen, the same way a catalyst works. Activation energy is the minimum energy needed for particles to react.
The graph has also displayed a substantial amount of information in different perspectives, showing a negative correlation was supportive evidence to my prediction. The negative correlation suggests that as the concentration increases the time the time decreases, which factually my prediction in other words. I can see the correlation by drawing a line of best fit, which a curve was passing through the points plotted on the graph.
Pre hence my investigation I made a smaller prediction, but not less significant, which was that doubling the concentration wouldn’t double the speed, and I also stated that the doubling effect wouldn’t be continuous. I found this hypothesis to be inconclusive, because the doubling effect never occurred. The prediction was half true and half false.
I didn’t expect this theory to be true with confidence because I had no scientific evidence to prove it right.
I came across the fact the time of the reaction finishing would start to level off.
Leveling off occurs because there comes a point of the level of concentration will have a frequency too high for acid particles to move freely and have a less noteworthy effect on the reaction, so that although the reaction gets quicker as the concentration increases the rate of the quickness will decrease.
Another way to read the graph and the trends was to draw gradients at the tangent of the curve.
I only did two gradients because that was all my graph would allow.
Gradients table
Further investigation of this was not done because my investigation came to a halt and certain evidence was lost which made restrictions on this subject.
This table shows me the steepness of the curve by dividing the b-value by the a-value. The first gradient was near the end of the curve and the second one was done near the start. I can see from the gradients that the greater value was gradient 1 and this meant that the longer you go along the graph the shorter the rate of reaction is which means less time used to react for higher concentrations. This evidence demonstrates where the steepness is; if the value is low the steepness increases and if the value is high the steepness decreases. From that I can conclude that this I definitely a negative correlation and my prediction is determined correct.
Evaluation
The only anomalous point I had was the 1M which I expected to be taking 700s, because my line best fit passes through its perpendicular line. I think I got this anomalous point because the reactions were never predictable and never had any clear patterns or trends than the negative correlation.
I think that if I had a smaller piece of magnesium ribbon and more hydrochloric acid the reactions would have quicker and maybe there wouldn’t have been any anomalous points.
All in all I think that the investigation went well because my prediction was proven to be true and I only had one anomalous point and I didn’t have any other of the factors affecting my reactions. My results were fairly controlled; I never had any problems with the impartiality of the tests. If did the investigation again I would have most things the way I did them in this investigation, but I would have changed things such as the time spent on the evidence obtaining and testing because I spent more time than planned, which led to other objectives being done hasty.
The limit to where my prediction can be supported by the results is when the curve of the line of best fit in the graph starts to level off, because eventually there won’t be a substantial difference between the different molecular levels and the rate of reaction.
The investigation has gone positively and proved my prediction to be correct.
Improvements
If could do this investigation again I would try to change my entire method for faster more effective results:
New method:
- Collect all apparatuses and variables needed for experiments, and check that everything is there.
- Measure variables to correct length or volume and units. Cut the 24 strips of magnesium ribbons to correct length (5mm). Measure each concentration in measuring cylinder to 10cm³, by using a pipette to extract 2HCl.
- Pour the measured 2HCl into test tubes.
- Put the Magnesium into the 2HCl tubes and time the time taken for the reaction to finish by using the stop clock.
- Convert time in minutes to seconds by multiplying by 60 and record results in the table. If the results are close the hundredth of a second make sure to round up or down e.g. 51.96=52 seconds.
- Cleanse measuring instruments and tubes and repeat the experiment 6 times because of the six different concentrations and each trial 4 times to calculate an average.
For faster results I would increase the volume of 2HCL and decrease the length of the mg ribbon and I would repeat the trials twice as many times.