Plan
The table below will show different variables that I will use for the investigation.
I will make this a fair test by making sure the volume of the acid, the room temperature and the mass of marble will be the same. I will heat the temperature accurately, and start and stop the stop watch exactly when the reaction happens and ends. This will make the experiment accurate as the results will be reliable.
Input Variable
We have decided to investigate: ‘How the temperature affects the rate of reaction.’
The temperature will affect the energy of the particles. This means that the more energy the particles have, the more chance of collision occurring so there would be a greater chance for a reaction. Also the more energy the particles have, the faster the reaction will occur, therefore this means, the rate of reaction would be faster as well.
Input Constants
We will be keeping the following the same:
- The amount of Calcium Carbonate- This will be measured with an electric scale. This will be kept the same throughout the experiment to ensure that the Hydrochloric acid will react with the same amount of surface area of Calcium Carbonate.
- The concentration of the Hydrochloric acid- This will be kept the same throughout the experiment so that the Calcium Carbonate reacts with the same amount of particles in the acid.
- The mass of Calcium Carbonate- This will be kept the same throughout the experiment, so that the same amount of surface area reacts with the acid.
- The volume of Hydrochloric acid- This will be kept the same throughout the experiment, because in all the experiments the amount of space the particles have, will affect the rate of reaction. If there is more space then the reaction may take longer. This is because the particles will have less chance of colliding with the Calcium Carbonate particles.
Output Variable
I will measure the time it takes for the reaction to stop. I will know when the reaction has stopped when the bubbles of Carbon Dioxide stop appearing. We know that bubbles will occur from the word equation; Calcium Carbonate + Hydrochloric acid → Calcium Chloride + Water + Carbon Dioxide. This will be an accurate way to measure the time. This is because each temperature will be repeated three times so I can get an average. We will be plotting Temperature against Time and Temperature against Rate of Reaction.
Equipment Chemicals
1 Bunsen burner Calcium Carbonate powder
1 Gauze Hydrochloric Acid
1 Tripod
2 Conical flasks
1 Measuring cylinder
1 Thermometer
1 Stop watch
Safety goggles
Make sure you wash your hands if in contact with Hydrochloric acid or Calcium Carbonate. Ensure that you wear goggles at all times.
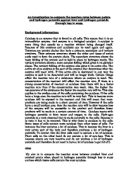
Diagram
Method
- Draw a results table ready to record the data in.
- Measure out 0.1g of powdered Calcium Carbonate using an electronic balance Measure out 30ml of the 0.5m Hydrochloric acid using the measuring cylinder.
- Set up the equipment, like shown in the diagram above
- Place calcium carbonate (0.1g) in the conical flask.
- Place the Hydrochloric acid (30ml)-in a beaker, on top of the gauge. Make sure the flame is blue/see through.
- Use the thermometer to measure the temperature, when at the temperature required pour the acid into the conical flask- start the stopwatch. We have to regularly check the temperature with a thermometer so that we can accurately measure how much kinetic energy the particles have.
- Watch the reaction, when the bubbles stop appearing stop the stopwatch.
- Record the time in the table drawn.
- Repeat the experiment a further two times (total of three times), record results.
- Repeat the experiments with the Hydrochloric Acid temperature at; 30°C; 40°C; 50°C and 60°C.
- Calculate average and place them into a graph.
Table of results
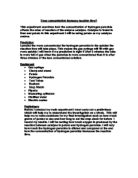
Graph of average results
We used the averages as this is more accurate. This graph shows that as the temperature increase, the time taken decreased. My graph shows a curve of best fit, and showed that the relationship between temperature and time taken is proportional, and shows strong negative correlation. This is because when temperature was increased, the particles have more kinetic energy, so they collide more as the speed in which they react will also increase, and the reaction occurs quicker. There was one anomalous result. This may have been because the Hydrochloric acid cooled down a lot during the process of the reaction.
Table to show temperature and rate of reaction
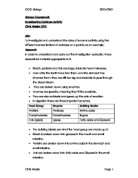
Graph for rate of reaction
Rate of Reaction means the speed at which the reaction takes place. This graph shows that as the temperature increased, the rate of reaction also increased. This is also proportional, as this had strong positive correlation. The temperature affects the rate of reaction as it affects how much kinetic energy the particles have, so collision could occur, so more collision means the reaction will occur faster. In this graph there was also anomalous point. There could be many reasons for this, one could be that we didn’t really measure the Rate of Reaction; we measured the time of the reaction so the results only show the average Rate of reaction.
Conclusion
In conclusion, my prediction was correct. I predicted that the higher the Hydrochloric acid temperature, the quicker the reaction will happen. This also means that the rate of reaction is quick as well. This is because, the higher the temperature means that the more thermal energy will be produced and converting into kinetic energy so that the particles will move faster and collide with other particles to cause a reaction. Both the graphs support this.
There were anomalous points on both the graphs; this is shown as they do not fit in with the curves of best fit. This could be because of a number of reasons. Firstly, the first graph testing, temperature and time taken could have shown a anomalous point because the Hydrochloric acid cooled down a lot, or the amount of powder could not have been accurate. These both will affect the reaction, and the time taken could have been more then it should have been.
Secondly, the other graph, rate of reaction and temperature, measures the rate;
At the start of any reaction the rate is at its fastest (a). During the reaction the rate starts to slow down (b). At the end there is no rate, this is when the reaction has stopped.
My graph also shows an anomalous point. This could be because; we measured the time of the reaction instead of the rate of reaction. Therefore the experiment will show a negative point, and below explains the rate.
Evaluation
My results were fairly accurate because the repeated results were closely together and all my points were on the curve or near the curve. Although my results were accurate, I had two anomalous points, one on each graph. I did not have any trouble carrying out the investigation. I f I did this experiment again I would repeat each temperature another three times. This is because I probably would not get any anomalies, and the average results would be more reliable.
Another experiment I could do to test “rate of reaction”. I could carry the same experiment out with Magnesium Carbonate or Zinc Carbonate instead of Calcium Carbonate. By using theses chemicals, I will still be able to find out if the temperature affects the Rate of Reaction. If I was to use Magnesium or Zinc Carbonate, then my conclusion would improve as I have another set of reliable evidence. Otherwise, we could test how much Carbon Dioxide would be produced, however we would need to use a computer to pick up the results. These results will be reliable, and I would be able to see if “Temperature affects the Rate of Reaction”.