Water will be used to dilute the acid.
Magnesium Strip will be put in the acid to see how long it takes to react.
METHOD:
To carry out this experiment I will use the equipment listed above. Firstly I will use a measuring cylinder to measure the acid and another to measure the water to dilute it with. I will then pour the measured acid into a beaker and add the water to dilute the acid according to the test. I will then put the Magnesium strip into the beaker that contains the acid, whilst simultaneously starting the Stopwatch. I will then observe the reaction and wait for the Magnesium strip to disappear in the reaction. When the magnesium strip disappears, I will stop the Stopwatch, record my findings on a chart and then pour out the solution and measure out a new amount of acid and water for a new experiment.
In my experiment I will have to consider the following variables: Concentration Of Acid, Amount Of Acid, Amount Of Magnesium and Temperature. To make my experiment fair, I will have to keep the Amount Of Acid, Amount Of Magnesium and Temperature the same.
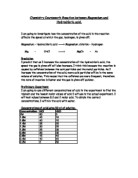
Before I start the experiment I need to do preliminary tests to see how the reactions would act. I done different tests with different amounts of hydrochloric acid and different concentrations to get and idea of how our experiment would go. Below is a table of results:
Preliminary test:
After taking the preliminary tests and gaining these results I have decided that a total solution of 10cm3 is not enough to get accurate results so I will have a total solution of 50cm3. This is because if I use 10cm3 there is no room for error, it must be very accurate. However if I use 50cm3 .
Results:
After taking the preliminary tests and deciding on how to do the experiment I began the experiment and gained two tables of results and wrote them down I also down an average table of results. Below is the table of results:
Test 1
Test 2
Average results
Analysis:
During the course of this experiment I noticed that whilst I was taking results my prediction was proven to be correct. As the concentration of acid became more dilute it took more time for the magnesium to react with the acid.
After doing the experiment and keeping all the variables the same apart from the concentration of acid I noticed that after each test the temperature increased but as the acid became more dilute the temperature did not raise as high as the test before it which had a higher concentration.
After recording my results in the two tables I have drawn my results onto graphs which will give me a better view on how the experiment went and if there is any anomouls results.
GRAPH FOR TEST 1 AND 2
GRAPH FOR THE AVERAGE RESULTS
EVALUATION:
During the course of the experiment I had only one problem and it was; to drop the magnesium strip into the acid solution whilst simultaneously starting the stopwatch. Although this was a problem my results were still accurate because as the graph and tables show the reaction times were alike but most importantly the graph shows that the reaction times from each test are near enough on the same point. I say this because, as graph 1 shows the Red and White points share the same point on the graph.
To make sure my results were reliable I constructed a table of average results. I’ve done this to see if my results were perfectly matched and by how much. The table and graph above show the average results between both tests.
In saying this I had 1 anomalous result and it is highlighted in black on Graph 1. The reason this occurred was because I either measured the acid incorrectly or I made an error timing the reaction. Either way I can use this to now use this to say I could have improved this experiment by using more accurate ways of timing the reaction and more accurate ways of measuring the acid. I say this because if I use more accurate methods I can guaranty I will have no anomalous results or mistakes.