Apparatus:
The apparatus used for the following experiment is shown below:
· A rubber tube
· A clamp
· A 100cm3 gas syringe
· A 100cm3 conical flask
· 75cm3 of hydrochloric acid
· A small digital scale
· A 25cm3 beaker
· A 75cm3 measuring cylinder
· 75 cm3 of water
· A stopwatch
· 6 x 5 grams of marble chips
Some of the above apparatus have been chosen for the following reasons. Firstly, the conical flask is good due to the fact that it will not "spit" because of
the shape of its mouth. The gas cylinder in easy to use and it is easy to read from, and both the tubes and the bung are airtight which prevents gas from escaping. The stopwatches are also easy to use and the clamp helps hold things in position, which is very helpful when carrying out an experiment.
Safety:
Before starting there are a few safety aspects, which we have to be careful of. Firstly, safety glasses should be worn at all times, and secondly, we have to be careful because the acid is highly corrosive to our bodies and should be kept away from skin and from our clothes.
Method:
The apparatus will be set up as in the diagram shown below:
Firstly the marble chips will be placed in the conical flask and 25cm3 of acid is then poured in. The bung is then applied and as soon as the bung is put in the stopwatch is started. When the gas syringe reaches 100 cm the time on the stopwatch is recorded. This same method was repeated for all the different concentrations. We have to make sure that after each concentration has been tested that we wash out all the apparatus so that everything stays fair. These results will then be tabulated and graphs will be plotted.
OBSERVATIONS/READINGS:
Results:
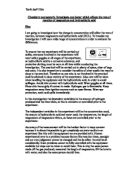
Volume of acid/cm Volume of water/cm Mass of marble chips/g Time to collect 100cm3 of Carbon dioxide 1/Time * 1000
50 0 5 10 100
40 10 5 12 83.33333333
30 20 5 17 58.82352941
20 30 5 26 38.46153846
10 40 5 43* 23.25581395
* This solution did not produce enough gas to reach 100cm on the gas syringe. The result therefore had to be estimated.
ANALYSIS OF RESULTS:
My results are plotted on two graphs, as shown below:
Graph One - To show concentration against Time
Graph Two - To show 1/time against concentration
EVALUATION
Results:
The graphs both show, along with my tabulated results, that my prediction is right. My prediction of the concentration being directly proportional to the rate of reaction is also correct. This is highlighted by the graphs, especially the second one. My prediction of the collision theory is also correct.
Conclusion:
From looking at my results and graph I am able to conclude that the more concentrated the acid the quicker the reaction happened and the more gas was produced.
Before I did the experiments I made some predictions they were that the more concentrated the acid was the quicker the reaction would happen and more hydrogen would be produced. This was completely correct because what I thought would happen did.
From comparing my graphs I can tell that the first graph is inversely proportional whereas the second graph is directly proportional.
At this point we are able to answer our main hypothesis, which was 'how does changing the concentration of acid affect the rate of reaction between hydrochloric acid and marble chips.´ The answer to this would be that changing the concentration of the acid will either make it go slower or quicker and more or less gas would be produced depending on whether the concentrations were more or less.
We can see that the collision theory is very important in this experiment. The collision theory states that if a solution is made more concentrated it means there are more particles of reactant colliding between the water molecules, which makes collisions between them more likely.
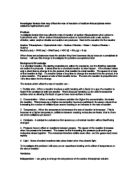
I did some further research and in the book Chemistry by J A Hunt and A Sykes it says that for every chemical reaction, there is a certain minimum energy needed in the collisions before a reaction can occur. This minimum energy is called the activation energy of the reaction. The basics of the collision theory are shown in the diagram below:
On the left the particles show a low concentration and there is less chance of collision whereas on the right the particles show a high concentration, which has a higher chance of collision, which increases the rate of reaction.
Evaluation and Improvements:
The main drawback with my experiment is that my Chemistry teacher gave the results to me. Having said this however, I interpreted these results and analyzed them myself. If I were to do the experiment again I could improve it by using a wider range of concentrations, which would lead to a more accurate line of best fit. I would also have done each reading more than once and taken an average, which would have increased the accuracy. Possible problems with my coursework could have been the caused by human error. Firstly, there could have been error in stopping the stopwatch, although this would have been minimal. Also, some carbon dioxide may have escaped from the tube.
Overall, however, I think that this experiment has been successful because my prediction has been accurate which shows that the results are accurate. I have also made sure that the test was done fairly.