- Measure 25 ml of hydrochloric acid (1 molar) in the other measuring cylinder
- Get the conical flask and the delivery tube
- Put the delivery tube’s one end under the bee hive shelf and attach the other to the bung
- Put 1 Mg strip 2.5 cm long in the conical flask
- Set the stop watch on count-up getting it ready to start the timing
- Make sure you have the table on hand to enter the results in
- Pour the measured hydrochloric acid in the conical flask and immediately close it with the of the bung and start the clock
- Measure the amount of gas produced in the measuring cylinder keeping in mind to measure from the lower meniscus, over the bee hive shelf every 20 secs until the reaction stops (you can tell that the reaction has stopped when you get the same reading three in a row
- Repeat this 2 more times making it a total of 3 times altogether
- Repeat the same procedure for 0.8m, 0.6m, 0.4m & 0.2m making sure the amount of hydrochloric acid is the same, no matter what the concentration, for each time the experiment is repeated.
This experiment didn’t give me any results due to some problem with the delivery tube.
I tried the pressure sensor experiment. The method below is the same method which I used in my actual experiment
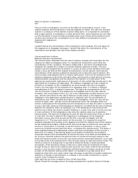
Apparatus:-
- Bung
- Delivery tube
- Conical Flask
- 6 Beakers (Glass)
- 2 Measuring Cylinders
- Pressure sensor
- Goggles
- Stop clock
- 15- 2.5 cm Magnesium Mg strips
- Hydrochloric acid HCl (1 Molar)
- Water
- Paper A4
Method:-
- Set up the equipment, get a conical flask and a bung with a delivery tube and a pressure sensor
- Get 6 beakers
- Fill one of them with water
- Get 2 measuring cylinders one for the HCl and one for water
- Get a piece of A4 paper and tear it into 5 pieces writing on them one of each of these ( 0.2M, 0.4M, 0.6M, 0.8M, 1M)
- Set the 5 beakers out and put one of the papers under each beaker
- Now for the dilutions follow the table below
Concentration Vol. of HCL Vol. of water Vol. altogether
- So for instance to make the concentration 0.8M put 80ml of HCl and 20ml of water into the beaker labelled 0.8M
- Get the Mg strips and set the stop clock on count-up
- Measure 25ml of HCl (1M to start off with) and pour it into the conical flask
- Get one strip Mg
- Now at this point you’ll have to do several things at once so it is better to get 3 people to help you
- Before you put the Mg strip into the flask get someone to be ready with the bung attached with the delivery tube and have someone else to be ready with the end of the delivery tube near the outlet of the pressure sensor so that it can put in immediately
- Get the third person to be ready to start the clock
- As soon as you put in the Mg strip the person with the stop clock start s the clock and the person with the bung should close the conical flask immediately while the person with the end of the delivery tube puts the end into the outlet at the same time
- Measure the time it takes for the pressure to reach 10 KPa and record it onto your table
- Repeat the experiment twice more for 1M concentration of HCl making it a total of three times
- Do this experiment 3 times for each concentration of 0.2M, 0.4M, 0.6M, 0.8M, 1M recording the time each time onto the table
This experiment gave me quite accurate results so I decided to use the results for my experiment. The results are the same ones that I used for my obtaining evidence. The results of my pre-test are on the next page.
This is the method I used:
Apparatus:-
- Bung
- Delivery tube
- Conical Flask
- 6 Beakers (Glass)
- 2 Measuring Cylinders
- Pressure sensor
- Goggles
- Stop clock
- 15- 2.5 cm Magnesium MG strips
- Hydrochloric acid HCl (1 Molar)
- Water
- Paper A4
- Ruler
Method:-
- Set up the equipment, get a conical flask and a bung with a delivery tube and a pressure sensor
- Get 6 beakers
- Fill one of them with water
- Get 2 measuring cylinders one for the HCl and one for water
- Get a piece of A4 paper and tear it into 5 pieces writing on them one of each of these ( 0.2M, 0.4M, 0.6M, 0.8M, 1M)
- Set the 5 beakers out and put one of the papers under each beaker
- Now for the dilutions follow the table below
Concentration Vol. of HCl Vol. of water Vol. altogether
- So for instance to make the concentration 0.8M put 80ml of HCl and 20ml of water into the beaker labelled 0.8M
- Get the Mg strips and set the stop clock on count-up
- Measure 25ml of HCl (1M to start off with) and pour it into the conical flask
- Take one strip Mg 2.5cm long
- Now at this point you’ll have to do several things at once so it is better to get 3 people to help you
- Before you put the Mg strip into the flask get someone to be ready with the bung attached with the delivery tube and have someone else to be ready with the end of the delivery tube near the outlet of the pressure sensor so that it can put in immediately
- Before you put the Mg strip into the flask get someone to be ready with the bung attached with the delivery tube and have someone else to be ready with the end of the delivery tube near the outlet of the pressure sensor so that it can put in immediately
- Get the third person to be ready to start the clock
- As soon as you put in the Mg strip the person with the stop clock starts the clock and the person with the bung should close the conical flask immediately while the person with the end of the delivery tube puts the end into the outlet at the same time
- Measure the time it takes for the pressure to reach 10 KPa and record it onto your table
- Repeat the experiment twice more for 1M concentration of HCL making it a total of three times
- Do this experiment 3 times for each concentration of 0.2M, 0.4M, 0.6M, 0.8M, 1M recording the time each time onto the table
Range:-
For this experiment I have decided to use 5 different concentrations 0.2M, 0.4M, 0.6M, 0.8M, and 1 Molar. I chose these ranges of concentrations because they are easy to calculate using 100ml volume of acid. I chose to do 5 different concentrations so that I would get a more accurate analysis.
Fair test:-
There are a few things that need to be done to ensure and maintain a fair experiment.
- Before starting the experiment make sure that the pressure sensor is on zero
- Make sure, when measuring acid read from the lower meniscus every time to get accurate results
- Make sure you put the bung onto the conical flask before you put the delivery tube into the outlet of the pressure sensor
- Stop the clock at exactly 10KPa on the pressure sensor
- Use the same volume of hydrochloric acid for all experiments
- Use the same length of the magnesium strips in all experiments
- The temperature should be kept constant at room temperature
- Make sure the concentration of the acid is changed each time after the experiment is done for each concentration three times
Safety:-
There are some safety procedures that need to be followed to ensure that the person doing the experiment is safe
- Wear goggles when dealing with acid
- Take precautions when handling acid making sure that you don’t get any acid on your hands
- In case of acid on skin make sure you wash the area affected immediately with luke warm water
- Make sure you do not drop any acid on the table but if it does happen wipe immediately to avoid anyone’s hand getting in contact with it
Prediction:-
I predict that the higher the concentration of hydrochloric acid faster the reaction between HCl and Mg will take place which will mean the rate of reaction will be high. To explain this lets have a look at the collision theory.
Collision theory is that when particles collide they may react. A collision occurs when a particle is facing in the correct direction and the collision has enough energy. If more collisions occur, then the chance of a successful collision is higher. Using a more concentrated liquid, means more particles are present closer together so they could collide more (concentration). (4learning.co.uk)
So increasing the concentration of a substance in solution means that there will be more particles of that substance in a constant volume. The acid particles can only react with the magnesium strip when they collide.
Look at the diagrams:
P.T.O
The acid particles move randomly through the water.
As you increase the concentration of the acid, there are more acid particles in the same volume.
Therefore there is a greater chance of acid particles colliding, and reacting successfully due to a higher proportion colliding, with the particles on the surface of the magnesium strip. The rate of reaction increases. (“Chemistry for you” by Lawrie Ryan)
I predict that the graph for the time taken to reach 10KPa will have a negative correlation and the line of best fit will be a curve. This is because as the concentration, which lies on the X-axis, increases the time which lies on the Y-axis will decrease causing the point for 0.2M concentration to be near the top of the graph and the 1M concentration to be near the bottom of the graph. To explain this I have sketched a graph which is, not to scale, just to give an idea of what I mean and how I expect the graph to look like.
I predict that the rate graph, which shows the pressure produced per second for that concentration, will have a positive correlation and that the line of best fit, will be a curve. Rate graph will have a positive correlation because as the concentration increases the rate of reaction will increase in other words the rate of reaction will be faster and so more pressure will be produced per second. This is because highly concentrated acid has more particles than the low concentrated, although the volume was the same, and so if there are more particles present they will collide more often which will increase the amount of successful collisions. More successful collisions mean that the rate of reaction is faster causing more pressure to be produced per second. To explain this fully I have sketched a rate graph, which is not to scale, just to give a rough idea of what I mean.
Analysis:-
My experiment shows that higher the concentration of hydrochloric acid faster the reaction took place.
I found a trend in the results table and the graph showing my results. As the concentration increased the time in secs decreased. My graph which is on the next page shows this. My graph has a negative correlation as I had predicted. My graph is inversely proportional.
The reason why my results show this is to do with the collision theory. Reacting particles need to collide successfully for a chemical reaction to take place. There must be enough energy in the collision to break the existing bonds between the reacting molecules. If there is not enough energy, then no reaction will take place and the molecules will just bounce off each other. Such a collision is known as an unsuccessful collision. Similarly if there are fewer particles present then the chances of collision is very low, and if there are fewer collisions then there’ll be less successful collisions. ()
Let’s look at it from concentration perspective. Increasing the concentration means increasing the amount of particles keeping the volume constant which means if there are more particles per dm³, there’ll be more collisions which will result in increasing the probability of the number of successful collisions. ()
I also worked out the rate of reaction for each concentration and drew a graph showing this. My rate of reaction graph shows that when the concentration was increased the rate increased too, following my prediction. This graph shows a positive correlation. I worked out the rate using this formula: pressure/time
Let’s look at the rate graph and see what that tells us. The rate graph is a complete opposite of the time graph because according to the collision theory if the concentration is higher the reaction is faster in other words higher the concentration higher the rate of reaction, whereas in the time graph higher the concentration the less time it takes for more pressure to be produced. They both mean the same thing but are showing different things, in other words it’s like looking at the same thing but from different perspectives.
The rate graph shows that when the concentration was higher the rate of reaction was higher too giving a positive correlation.
In my investigation I looked at the effect of concentration on the time it took for the pressure to reach 10KPa. According to my prediction as the concentration is increased the time should decrease. Looking at the graph you can see that when the concentration was 0.2Molars the average time it took for the pressure to reach 10KPa was 448 secs, whereas if we look at the time it took for the pressure to reach 10KPa for the concentration of 1M, which was 23 secs, was incredibly lower. This was because in 0.2M concentration the number of particles in the acid was fewer so they collided less often which meant that there were less successful collisions and so it took the pressure to reach 10KPa longer. This means that Mg and HCl took longer to react which is why the time is so long.
On the other hand the acid with the concentration of 1M took less time because there were more particles present, although the volume was the same, which meant that if the numbers of particles are higher then there will be more collisions, ultimately causing more successful collisions. This is why the reaction time for 1M was less.
So to sum it all up, if the concentration of a substance is high the rate of reaction will be high which means the reaction will be faster and more pressure will be produced in less time, if the concentration of substance is low the rate of reaction will be low which means the reaction will be slower and less pressure will be produced in longer time span as I had said in my prediction showing clearly that my prediction was right.
Evaluation:-
I think that overall my experiment went quite well and my method was quite good as it gave me quite accurate results. In my experiment I didn’t get any anomalous result which suggests that my method was quite accurate. Although there couple of points which don’t lie on the best fit line they still follow the same pattern. Although if I had to change my method I would use a bung with two outlets, one connected to a separating funnel and the other connected with the delivery tube leading to the pressure sensor. This would prevent any gas being lost as I would be able to put the acid through the separating funnel while my partner would start the clock for me and so no gas would be lost and the timing would be accurate giving more accurate results as opposed to me having to put the magnesium strip into the acid
and putting the bung on and then putting the delivery tube into the pressure sensor outlet and starting the clock, which wastes time and some gas is lost.
My results were inline with my prediction which meant I could draw an accurate conclusion using the help of my results. My results followed the collision theory and the rule for increasing concentration which gave me an accurate results table, accurate graph and an accurate rate graph which helped me draw my conclusion and form a pattern.
If I were to do this investigation again I would test a different factor such as temperature. The below is part of what I would do in an investigation concerning the effect of temperature on the rate of reaction between hydrochloric acid (HCl) and magnesium (Mg).
Aim: - the aim of this investigation is to find out how temperature affects the rate of reaction between Magnesium (Mg) and Hydrochloric acid (HCl).
Method: -
I will use the same method as I did in my experiment but instead of using the concentration table I would use a water bath to heat the acid to these temperatures:
25°C, 30°C, 35°C, 40°C, 45°C and then carry out the experiment using these instead of using different concentrations. The diagram below shows how the experiment will be set.
Prediction: -
I predict that as I increase the temperature the rate of reaction will increase too. To explain this you have to look at the collision theory. In order for particles to react they need to collide successfully, enough energy and sufficient amount of collisions are needed for successful collisions to take place. Increasing the temperature would mean that there will be more energy (in the form of heat) for the particles to collide. More energy will cause the particles to move faster and this will result in particles colliding. If there is enough energy when collisions take place then there is a reaction. Since increasing the temperature results in more energy then the colliding particles will have enough energy to collide successfully and so the rate of reaction will increase (more pressure produced in less time).
The sketched graph below shows roughly what the graph of results should look
like.
The sketched graph below shows roughly what the graph showing the rate of reaction should look like.