I also predict that the relationship between the length and the resistance will a directly proportional relationship. A directly proportional relationship means that as one dimension increases, the other dimension increases by the same amount.
E.g. as the depth of a water tank slowly increases, so does the volume of water within the tank at the equal rate.
Apparatus
Before I started my investigation, I prepared an experiment to help me find out how length affects resistance. Before I started, I chose specific apparatus that I was to use. Following is a list of apparatus and what use they had in the experiment I carried out.
The power supply in this experiment.
The wire being tested for resistance.
A device used to measure current in a circuit.
A device used to measure voltage in a circuit.
- 3 positive connecting cables
To connect the power pack, Nichrome wire, ammeter and voltmeter together to form part of the circuit.
- 2 negative connecting cables
Used to connect the power pack, Nichrome wire and voltmeter together to form part of the circuit.
Safety precaution used to absorb the heat produced by the Nichrome wire. In this experiment a ruler will be used as a heatproof mat as well as a measuring technique.
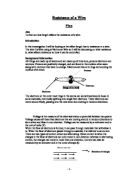
The purpose of the experiment I am going to carry out is to find how the length of a piece of wire can affect the resistance level in the wire. The experiment I carried out was very simple to do but not that simple to explain. Therefore, I will explain how to construct the circuit I made in steps.
- Connect one of the positive cables (displayed as the red lines in the circuit diagram above) and put it into the positive hole on the power pack.
- Put the other side of the same cable into the amps hole on the ammeter (this may say 10A next to it)
- Using another positive wire put one side into the ‘common’ hole in the ammeter.
- Put a crocodile clip on the other side of the same wire and place it onto the 0cm mark on the Nichrome wire.
- Place one of the sides of the last positive wires into the top of the positive wire on the 0cm mark on the Nichrome wire. You should find they fit together without any trouble.
- With the other side of the same wire place it in the positive hole on the voltmeter.
- Put one side of one of the negative wires (displayed as the black lines on the diagram above) in the negative hole on the power pack.
- Put the other side of the same wire on the 100cm mark on the Nichrome wire, using the last crocodile clip.
- With the last negative wire, put one side in the top of the negative wire that is attached to the Nichrome wire. You should find they fir together easily.
- Lastly, put the other side of the same wire into the ‘common’ hole on the voltmeter.
You should now have a parallel circuit in the same order of components as the one shown above. Now I started taking down the readings.
Obtaining Evidence
Method
After I ha set up the circuit correctly, I started to start using it. To take down the reading I first turned the dial on the ammeter to 10A and the dial on the voltmeter to 20V. Then I made sure that the ‘positive’ crocodile clip was on the 0cm mark on the Nichrome wire and the ‘negative’ wire is on the 100cm mark. I turned the dial on the power pack to 4V and turn the plug on. I turned the switch on and took the readings from the voltmeter and the ammeter as soon as the numbers had stopped changing. I then switch off the power pack again and move the crocodile clip on the 100cm mark ten centimetres down to 90cms and switched on the power pack again. Again, I took the readings from both ammeter and voltmeter. Every time I had taken down the readings I moved the crocodile clip down ten centimetres, until I got to the 10cm mark. All together I had ten sets of readings.
Safety
In this experiment, safety was my number one priority. I took precautions to make sure that the experiment was as safe as possible. These were as follows
- After every time the readings had been taken, the power pack was switched off in case of accidence and stopping the wire from getting too hot.
- As little contact was made with the Nichrome wire to prevent injuries.
- Special care was taken with the shorter lengths of wire (i.e. 10cm, 20cm, 30cm) for there is a lot of current running through a short distance and making the wire glow red.
- All power must be switched off before any part of the circuit is handle.
This experiment was not very dangerous but in spite of that safety precautions were still acted out.
Fair Testing
This investigation I am carrying out would not be valid if it were not fair. To make it as fair as within my limits I performed some tasks. These are as follows
Constant Variables
In my investigation, I am testing how one variable effects resistance. In aid of this, I had to keep all the other variables constant. I kept the temperature at room temperature because it was an undemanding temperature to maintain. Although no serious cooling or heating had to be done to get the wire to a specific temperature, the wire was left to get back to room temperature before the readings commenced. This was to make sure that temperature would not effect the level of vibration caused by the metallic atoms and hence, interfering with the resistance level. Also to sustain a constant temperature, the wire was kept out of contact to prevent body heat from transferring and after every reading the power pack was switched off.
The type of wire I used was Nichrome wire and was not changed throughout the experiment. This kept the type of wire constant.
If the type of wire was not changed throughout the experiment, there was no way the cross sectional area of the wire could change substantially. This variable was kept constant.
The power pack remained on 4v all throughout the experiments.
Preliminary
Before I started taking my actual readings, I carried out a preliminary experiment. This was to familiarise myself with the circuit and also do ‘trial and error’. I tested the circuit for faults that would arise when taking the readings for the actual experiment. This way I could prevent any faults from occurring and make my results more accurate.
Actual Results
When I had taken down all of my readings, I created a table, displaying all the required information.
The experiment was completed twice for optimum accuracy within my limitations. Also the average and all the results were rounded to two decimal places as this inserted a common denominator.
Analysis
Findings
After having completed the experiment and analysing the readings, I can confidently state that the resistance of a Nichrome wire increases, as the length increases. This is due to the collisions between metallic atoms and the electrons in the current. Also as the resistance increases, the current decreases at an equal rate. The movement of free electrons together all flowing in one direction make current. The vibration of the fixed, metallic atoms within the wire creates an opposition for the free electrons. If there is more resistance this means that the free electrons are having a stronger force opposing them. This causes the current in the wire will decrease at the same rate as the resistance is increasing. This permits the current and resistance to have a directly proportional relationship and allows the formula used to calculate resistance to work well.
R=V/I
Graph Analysis
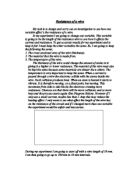
With both experiment one and experiment two, I created a graph from the results. The graph displayed the actual, average results and also included the line of best fit. This was drawn on from the origin and going through as many actual points as possible. Then I drew lines from the 10cm, 20cm, 40cm, and 80cm point on graphs up to the point where it met the line of best fit. Then I took it across to get a reading. The predicted from theory results were plotted on experiment 1 graph but not on the experiment 2 graph.
After having looked at the graph there are many statements I can make using the graphs as evidence. The first is that the relationship between the resistance and length of the wire was directly proportional. The results were not exact but were as accurate as they could be within my experimental accuracy. The boundaries of accuracy were due to lack of equipment. As you can clearly see on the graph as the length increases so does the resistance at an equal speed.
Trends
Both graphs have a positive correlation. This means that both resistance and length both increase. Length is the independent variable in this experiment so it increases in length because I increased it but resistance being the dependant variable could have decrease as the length increased, leaving a negative correlation. Instead the resistance did too increase leaving a positive correlation. At the 10cm point on the graphs from both experiments, the reading was approximately 0.85 Ω but at the 100cm mark on both graphs it was approximately 7.71 Ω. this shows that the resistance rises from 10cms to 100cms.
Quantitive Analysis
After gathering my results I carried out many test to see whether the results I had got were correct. I predicted that as the length of the wire doubled so would the resistance in the wire. Using the result for 10cms doubled my result to see whether the results in theory corresponded with my actual result. This is a way of seeing whether my results were accurate or not. I also compared my results to the where the line of best fit crossed my 10cm. 20cm, 40cm, and 80cm mark on my graph to check whether it too corresponded with my results in theory. I did this for both experiments and rounded the results up to one decimal place.
Experiment 1
Experiment 2
Evaluation
Procedure
To get the results needed in this investigation, I had to carry out an experiment. The experiment was fairly easy to do but there were some parts that needed more care than others to make sure of optimum accuracy. Such measures as switching the power pack off and having as little contact with the wire are only a few of the fair testing precautions taken. This stop any imbalances with the temperature but all the variables not being investigate were maintained with the same level of importance.
I felt that the experiment had to be done only twice for the results were very similar and there were not any major differences. I felt that the results I ha got were reliable and accurate enough and there was no reason to do the experiment again.
Inaccuracies
When commenting on the results of the experiment, all the results seemed a little inaccurate at first glance. Some had differences a few hundredth of an ohm too many but when plotted on the graph a visible trend could be seen. Also when rounded to one decimal place they looked more accurate. These were not recorded as one decimal place, due to some lengths had the same answer as they were rounded either up or down. This mutated the trend that could be distinguished at two decimal places. Hence, the reason they were recorded as so.
A major source of error was due to the crocodile clips. Due to their width the absolute exact measurements could not be taken when I was placing the crocodile clips on the Nichrome wire. This could have differed the length by a millimetre or two but could still of caused some error. This was something I could not change and had no power over.
The experiment ha limitations of accuracy and the results received reflected this fact.
Anomalies
There were only two real anomalous results in this experiment. These were at 80cm where the average reading was 6.34 and did not fit the line of best fit of come and at 20cms where there was a big difference in the readings of current and resistance in the two experiments. The readings for current were1.73A in Experiment 1 and 1.82A in Experiment 2, a difference of 0.09A. As for resistance, the calculated results were1.54Ω and 1.64 Ω, a difference of 0.1 Ω. The reason for this is still oblivious to myself but I am assuming it was the consequence of not allowing the wire to have a long enough time to come back to room temperature. This could also be a result of lack of equipment that limits the accuracy in this investigation.
Changes
The experiment that I did was a very was of exceptional quality. It provides the results needed in a simple and understandable procedure. Even though this is true, there are some factors that lea to error in my experiment. The temperature of the wire was kept at room temperature. This was an easy temperature to maintain but there was no device in my experiment that allowed me to see what the temperature of the wire was and allow me to compare it to the room temperature. This would allow a certainty that the wire was back to room temperature instead of guesswork on whether it had had enough time to cool. To improve the experiment in I would a in a device to measure temperature. If I were to go back to the investigation, I would redo the anomalies. This being only one length that is 90cm.
Reliability
The results given provide reliable evidence to state that resistance in a wire is affected by length. As you can see from the graphs as the resistance increases at an equal rate to the increasing length. It also shows that the relationship between the length and resistance in actual fact is one of a directly proportional sort. From this I conclude that resistance is affected by length. This also means that the predictions I made at the start of the investigation were correct.
The results have a substantial amount of reliability in and many have been the same numbers in both experiment. Such as at 10cm both ammeter readings were 2.44A, at 80cm the ammeter reading was 3.26 in both experiments. In other cases the difference was only one or two hundredth of an amp. At 20cm, 40cm, 50cm, 60cm, 90cm and 100cm this was the case. Most of the readings were on the line of best fit or very close by.
Improvements
To extend the investigation to a higher level of accuracy, the next step to take would be to test the wire at shorter lengths (I.e. test it every 5cms instead of every 10cms). This would increase the amount of evidence stating that length does affect resistance. Also to broaden this investigation on resistance, testing the other variables and carrying out experiments would also aid the research on resistance. Also the affect on resistance and temperature caused by semiconductors and thermistors would also extend the research further.
In this investigation the voltage and current were vital. Without them the equation used to calculate resistance(R=V/I) would not work. The ammeter and voltmeter in this case were very important components in the circuit used. In fact the reason for the circuit was not to find the resistance but to find the voltage and current so resistance could be calculated from the readings. The ammeter was placed in a series with most of the other components so it operated correctly and the voltmeter was placed parallel with the Nichrome wire. Voltmeters measure voltage between two points so it is essential that the voltmeter be place parallel with the two point that need to be tested, only making contact with the two end of the length of wire being tested.
Current
The results from the ammeter were a vital part of the experiment. This meant that they had to be as accurate as possible. At a few lengths the current was slightly different. I
As you can clearly see, the results did not differ greatly but there were a few such as at 20cms, where the results differed 0.09amps. At first it seemed like an anomalous result but in actual fact it is roughly 0.1 amps, which is to be expected due to lack of equipment.
Resistance
After the resistance was calculated for both experiment one and two, I found the difference between them to see if there were any major inaccuracies. The biggest were one tenth of an ohm, which were at 20cms and 60cms. Like the current, this was expected and is a consequence of lack of equipment.
Percentage Difference
To compare the actual results and predicted results, I transformed the difference between them into a percentage. Using the results for 10cm I made predictions for what the other results should be if my prediction were correct. This allowed me to be aware of how large the difference was between the two. The results were first rounded up to one decimal place and the following equation was used to find the percentile.
Percentage=Difference/Predicted Results*100
The percentages were rounded up to the nearest whole percent. As you can clearly see the differences are very minimal and are all under 10%. The smaller the percentage difference, the more reliable they are.
Conclusion
In conclusion to having completed the whole investigation, I conclude that the predictions I made at the start were correct. The resistance did increase as the length increased. This was due to the increase in probable collisions between the metallic atoms and the free electrons that are passing through the wire. The resistance and length did have a directly proportional relationship. As said in the reason for this prediction, if the length of the wire were to double, so would the number of possible interactions, which would double the resistance. This would be the same if the length were to triple or quadruple.
I feel that the investigation was a success in most ways but it did have minute faults that could have been avoided with more equipment. Such anomalous results could have been prevented and if I had to do the same experiment and investigation again, there are some things that I would take into consideration that I may have paid little attention to the first time. The preliminary test was to familiarise myself with the circuit and procedure but not all the sources of error in the circuit had arisen in the preliminary experiment. This is the reason they were not prevented after the when the actual experiment was to be done.
On an overall feeling about the experiment, I feel that it was an accomplishment in research over resistance and the results derived from the test were reliable and can be used in evidence when proving that length does affect resistance in Nichrome wire.