Safety points
Safety is important to keeping the experiment safe and to stop anything dangerous happening.
∙Water must be kept away from the experiment because I am using electricity and putting water with it is dangerous.
∙ If I leave the Low Voltage On for too long it will heat the wire up and will start to burn.
∙ The voltage must be kept low otherwise it could heat up the wire.
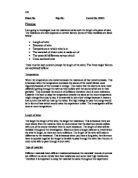
Apparatus
1x Low Voltage Unit
1x Sellotape
1x Ammeter
1x voltmeter
1x 1 metre of Nichrome Wire
1x 1metre Ruler
5x connecting leads
4x crocodile
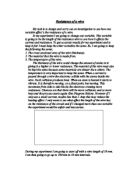
Range
I will measure voltage and current at 5cm intervals, then using the results calculate the resistance for each 5cm.
For example my wire length will decrease every 5 cm(100,95,90,85.….)
This will give me 20 more accurate results instead of just 10.
Prediction
I predict that the longer the piece of wire, the more resistance. I predict this because the more wire there is the more fixed atoms there will be. Which means more obstacles for the electrons to get past, and should therefore make more resistance.
My preliminary experiment
For my preliminary experiment I will test 50 cm of Copper and Nichrome wire to find out which wire is my suitable for my investigation.
After doing my preliminary experiment I have decided to use the Nichrome wire because the copper wire heats up to easily, the heat then affects the resistance and makes the results unfair. Also the numbers I got for the resistance of Nichrome are closer to whole numbers and are much easier to plot onto a graph.
In my experiment I will use 1metre of Nichrome wire instead of 50 cm because it gives more accurate results and a larger amount of results.
Analysis
The results of my experiment show that as the length of the wire increases so does the resistance.
On my graph for the reaction/wire comparison, the resistance rate increase steadily, from looking at my table of results and studying my graph it appears that longer amounts of wire have nearly double the amount of resistance that half the length does. For example at 100cm the resistance is 4.74Ω and at 50 cm the resistance is 2.44Ω.
2.44 x 2(doubled)= 4.88 this is just 0.14 off double.
To prove there are more than one:
20cm = 0.96Ω 30cm = 1.38Ω
40cm =1.87Ω 60cm =2.88Ω
This shows that the rate of resistance doubles every time the length does.
The results are like this because the more wire used the more fixed atoms there are and this means there’s more for the electrons to get past to create a current. So twice the amount of wire should be twice the amount of resistance.
My results match with my prediction, and the graph and tables look how I expected them to look. I have proved that the amount of wire does affect the amount of resistance and the longer the length of wire the more resistance there is.
Evaluation
The experiment was fine to do but the numbers on the Ammeter and Voltmeter kept flickering. This made it quite hard to take an accurate reading but surprisingly the results came out alright and were realisable. They came out very close to my line of best fit. There was no anomalous results and my results made a straight line.
My results were great. They are accurate because they are close to the line of best fit and this shows that they are accurate as the resistance progresses in equal ohms. There are no anomalous results o my graph.
My results are reliable because they show the correct result, but it was quite hard guessing what reading to take of the voltmeter, luckily I took good readings and got efficient and accurate results.
The experiment was a good way to investigate whether the length of wire affects resistance. There are a few things that can make it difficult to do for example the wire heats up if you leave the power running through it and more heat affects the resistance. This can easily be solved if the power is left on for a shorter length of time, then the wire has less time to heat up and more time to cool down.
I didn’t have any major problems during the experiment.
Although I did not get any anomalous results if I had a few of the factors that would have affected the results would have been faulty equipment taking inaccurate readings or the wire could have heated up and caused the resistance to increase unfairly.
If I was to further my investigation I would experiment with a few differences. I would have liked to use three different types of wire to see if the type of wire affects resistance and I would also change the thickness of the wire.
All the results would be collected in a table and then drawn into a scatter diagram and compared with each other.