Also I predicted that if we increased the thickness of the wire then the resistance would decrease. This is because if the wire is thicker there are more atoms at a cross section of the wire. This means that there are more atoms for an electron to ‘jump’ to. So if the cross section is bigger then there are more electrons at any given cross section. This in turn means that if there is a higher current in the thicker wire, the higher current means a lower resistance.
Apparatus
We used a lot of apparatus for measuring the resistance for length and width, these include:
-
Power Pack
- Wires
- Length of wire with different gauges
- A voltmeter
- Ammeter
For measuring the temperature we needed:
- Bunsen Burner
- Heat Proof mat
- Wires
- Thermometer
- Clamp Stand
- Clamp (2)
I took this photo during after the experiment
- Tripod
- Sand Tray
- Coiled Wire
- Wire Cutters
My Experiment
At the start of our experiment we started with preliminary work, this consisted of us investigating what would be best for our main body of experiments on resistance due to the temperature of the wire. At first we tried using a wire that was coated in a protective vanish so it wouldn’t matter if they touched. However this wire didn’t have high resistance. We submerged the wire in distilled water so the water would not act as a conductor. Although when we did the experiment we found that the wire had little resistance that an increase in temperature by 80ᴼc, the resistance did not increase or decrease substantially. Next we did the same experiment with Nichrome, a higher resistance wire, however this had no protective vanish, meaning that we to take care not to allow the wire to touch.
We repeated the experiment and this time we had a more resistant wire, we found that as we got close to 100ᴼc the resistance increased, this mean that when we did this experiment for real we knew we would have to find an alternative way of acquiring higher temperatures because we needed higher temperatures. Then we decided on using sand tray to heat the wire in, this is because they will heat to higher temperatures, this is because it allowed us to heat it to hotter than a Bunsen flame without evaporating. We also knew to start the experiment at 100ᴼc as that was where the resistance started to increase.
-Investigation
For the investigation for length and width, we used a 28, 36 gauge. We started with the 28 gauge and I measured the resistance from 40 to 160cm (every 10 cm). I repeated the experiment twice so we could eliminate any outliers, also this would allow us to work out a mean, and add range bars to our graphs. We then did the same for the 36 gauge, as well as repeating it twice. Then we worked out the resistance by using R=V/I, and the average of these results. We then used these results for a scatter graph, drawing a line of best fit showing marked outliers, and added range bars every 20cm.
For the temperature investigation we used a coil of wire, this was made from Nicrome. This is because it has a high resistance. Then we buried the wire in the sand tray so the hot sand would encase the wire, allowing the wire to be heated. We then connected the coil to a Micro-ammeter than we set to show the resistance, not amps. After this we heated the sand with 2 Bunsen burners to 100ᴼc, as one did not heat it quickly enough. Then we measured the first measurement of resistance at 100ᴼc, increasing the temperature too over 300ᴼc. Taking s measurement at every 10ᴼc. At one point in the investigation the heat started to melt the plastic coating around the wires, we quickly noticed this was a problem so we attached the wire to a clamp, this was to stop the bare wire touching the metal sand tray, as this would cause the resistance in the metal of the tray to be measured as well, this would cause the ammeter to short circuit. After collecting results, we plotted a scatter graph, drawing a line of best fit, we also indicated any anomalies.
I took the photo myself
Safety
When doing our investigation we had to take into consideration the safety aspect, this is because we were using very high temperatures up to 300ᴼc. We used safety goggles to protect our eyes from the heat, and in case of spitting from the water in the preliminary work, to the sand in the main experiment. We also kept or distance from the experiment to protect from heat and spitting just like the goggles. After we’d finished we left the equipment to cool before the technicians to clear away, with a safety sign. We also used heatproof mats so the worktop was protected, as well as this it protected glass or porcelain pieces of equipment from thermo-shock (high to low temperature, very quickly)
http://www.amazing1.com/Graphics/oly-lsg-4-1.jpg
Obtaining Evidence
Before we began our real experiment we carried out preliminary work to find out what was the best was to test the resistance of a wire, or how we could. So we tried using temperature as something that would either increase of decrease the resistance. In our preliminary work we found that the resistance started to change when the temperature exceeded 90ᴼc. However we found that this was a problem because we were using water to heat the coiled wire. Waters boiling point is 100ᴼc so we had to discard the idea and change it. So we used a sand tray as sand has a much higher melting point then water. We also repeated many of the experiments as well as the preliminary work to find out whether or not this was just a case of human error, and that we didn’t need to change the experiment.
Also in the temperature experiment we used Copper at first; we then used Nichrome as this has a much higher resistance so the results would not be as high.
In my results we identified outliers, and also calculated a mean, or the average for all of the results for the change in length of wire/thickness. In the first experiments for length of wire we didn’t specify a length of time that we were going to measure resistance on the wire for, we just laid the wire on the other wire, however this would have heated the wire giving us less accurate results. I decided to change this by only touching the wire for 2 seconds at every 10cm, allowing enough time to obtain results, but not long enough for the wire to be heated.
http://reprap.org/mediawiki/images/9/99/Blunt_step10.jpg
Patterns In Results
In our results there were many patterns shown, for example as the length of wire increased in the length/ width experiment so did the Resistance of the wire. As well as this as the temperature increased further and further, the resistance of the wire increased as well. These patterns both show that our predictions were correct. However in both of these experiments’ there were a few anomalies. For example lengths 130cm on 28 gauge wire, and 150cm on 36 gauge wire. In the temperature test, temp 140ᴼc and 250ᴼc were anomalies.
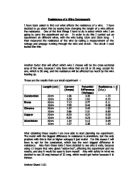
Conclusion
My results show that as the length and the thickness of the wire increased, so did the resistance, which supports what my prediction. This is shown because when the length of wire was 40cm long (28 gauge) the resistance average was 2.9 ohms, at 100cm the resistance average was 5.4 ohms and finally at 160cm the resistance average was 7.9 ohms. This is then supported by the 36 gauge wire, at 40cm the resistance was 9.2 ohms, at 100cm the resistance was 19.2 ohms and at 160cm the resistance was 27.7. This clearly shows that there is an increase in resistance when there is an increase in length.
In the temperature experiment my results show that as the temperature increased so did the resistance of the wire, however there were a few anomalies in the experiment. At 100ᴼc the resistance was 1.5, as the temperature increased to 220ᴼc the resistance was 3, however at 240ᴼc the resistance was 2.9, this shows an anomaly in the results. After the temperature increase again so did the resistance e.g. at 300ᴼc the resistance was 3.6
Overall I think that my conclusion supports what I wrote in my prediction. This is because I predicted that as the length/temperature was increased so would the resistance of the wire. My experiments were a success. However if I were to do this again I would repeat each of the experiments more times to eradicate any anomalies that may have occurred through the investigation.
Evaluation
I think that my investigation went well, this is because my results that I have gathered support what i wrote in my prediction. However they were a few problems in the experiment for example, when we increased the temperature one of the connecting wire began to melt, this was due to the wire been too close to the Bunsen’s flame. This made our experiment short circuit, meaning we had to start the investigation from scratch. Also in our length experiment the wire began to heat higher than we wanted because of the current in the circuit, this could have made our results less accurate.
Although the wire may have heated more than we wanted I still believe that the results were very accurate, as we only had 4 outliers in all of our results. I think that the level of accuracy in my results is very high because we repeated each one of the experiments more than once. To increase the level of accuracy in the results I think that if I were to repeat the investigation I would repeat them more than just once; this allows you to eliminate any anomalies that occurred. There were a few anomalies in my experiment these were:
- 130cm on 28 gauge wire
- 150cm on 36 gauge wire
- In the temperature test, temp 140ᴼc and 250ᴼc were anomalies
I think the anomalies for the length experiment will have occurred because of human error e.g. not reading the results correctly, or touching the two wires together for too much time, this would cause the wire to heat up, causing a false reading of the resistance. In the temperature experiment, I think the anomalies may have also sprung from the connecting wire becoming too hot, meaning that the resistance would not have been the right reading. As well as this, if the connecting wires touched the side of the sand tray, this would cause the reading to be lower so this may have occurred at some point during the experiment.
In the investigation we repeated some of the experiments more than once; this allowed me to make my results more reliable. Also it allowed us to eliminate anomalies. I think that I should have taken more results because I still have anomalies in my results. However I did check if my results were correct by repeating each of the experiments more than once. When I did repeat the experiments the results I got were identical apart from the anomalies which some of them did not occur more than once. This proves that by repeating them it reduced the number of mistakes made. I also think that the range of results I collected was sufficient to give me answers for my prediction and conclusion.
If I had to use my results to as evidence to back up my conclusion then I would be very confident. This is because my evidence supported my prediction, and all of the evidence was clear and easy to show in many different ways, whether in a table, bar/line graph or in any other form of data representation. I believe that I could use my results as evidence because it clear, concise and is very easy to understand. Thing that I could do to improve my investigation would be to make sure that there was only one variable (one thing I was changing) and to ensure that all aspects of human error were eliminated before starting the experiments. One further experiment that I would do would be to use a wider range of material for the coil of wire to give me more evidence, such as how the material changes the resistance.