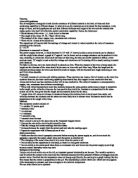
Diameter: The diameter of the wire will be kept constant throughout the experiment. This is important because it affects the overall area of the wire. The resistance is inversely proportional to the cross-sectional area. The only way in which the area of the wire should be changed is in length. An increase change in diameter would affect the number of fixed atoms that the free electrons could collide with and would produce inaccurate results with regards to resistance. The smaller the diameter the better, as it will mean a smaller all-round area which will make it possible for more results to be taken, as the amperage would not have so great an effect on the wire’s temperature. Also, the larger the diameter, the easier it would be for the free electrons to flow through, just as water flows more easily through a wider pipe than a thinner one.
Type of wire: All metals have different properties, and in order to make the test fair, the type of wire used must be kept the same. I have chosen to use nichrome as it has good properties - which have been tested in the pre-test. It is also important to keep the wire straight, as this will make it easier to measure.
Length of wire: The length of the wire is the variable that I shall be changing. I have chosen to do so in 5cm stages. It is very important that the wire is measured accurately, as otherwise the readings off the ammeter and voltmeter will not be as accurate as they could have been. To do this, we are using a ruler, but one problem that we are likely to encounter is the fact that is will be difficult to measure around the top of the rod on which the wire is fixed. So as not to get inaccurate readings, I am going to disregard the reading at 35cm, as that is the length that falls upon the end of the rod.
Pre-test
It is important to conduct a pre-test before doing the actually experiment. In this pre-test, I have tested 3 types of wire: nichrome, copper and Constantan, to which is most suitable for the experiment. I did the pre-tests on a computer program.
Diameter
I tested the three available metals using the computer program to find out how close to the maximum of 1 amp I could reach by adjusting the diameter of the wires. I want the amperage to be as close to 1 as possible because the amps will go down as I do the experiment, and I want to get a lot of results. The amps must not be above 1amp, because this would mean that the wire would get too hot, and the results would be inaccurate, as I have previously explained. Here are the results:
As you can see from my results, nichrome is the material which best fits my criteria. Its diameter can be comparatively much larger than that of the other two wires, whilst still having amperage of around 1amps. On the computer program we used, any increase in the diameter of the wires above that of the results in the table above, would have given a reading of above 1 amp, which is my chosen limit. From these results I can conclude that the best diameter for the nichrome wire would be 0.17mm because it gives amperage that is as close as possible to 1amp. It will also make it easier to average out results when finding resistance using the volts as well.
Suitable wire
Unfortunately, in the actual experiment, we will not have a choice of diameter for the wire. Because of this, I have conducted a second preliminary experiment to confirm that nichrome is in fact the best wire to use. In this experiment, I kept the following variables constant:
- diameter = 0.2285
- number of batteries = 3 cells
- length of wire = 5cm
The aim of this experiment is to find out which metal would give the lowest reading on the ammeter when the three variables above were constant. The only variable changed was the type of wire. Here are the results:
Although none of the metals with these set variables could produce a reading below 1 amp, the lowest was nichrome. This confirms that nichrome is the best wire to use in the main experiment. The hotter the wire gets, the less accurate the final results will be as the extra vibrations in the wire will slow the path of the free electrons, which will result in an apparent increase in resistance. This inaccuracy can be minimized if the current is low. I have concluded that nichrome is definitely the best available wire for use in the final experiment. It also has the highest resistivity:
The resistivity values of each wire is as follows:
nichrome = 103 x 10-6Ωcm
Copper = 1.56 x 10⁻⁶Ωcm
Constantan = 48 x 10-6Ωcm
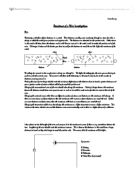
If at any point in the experiment, we need to adjust the size of the current, we can do so using a rheostat.
Testing nichrome
Finally I tested to see that the experiment is going to work. Using the variables that I have previously decided on. These are the results:
It is clear to see here that nichrome will be suitable for the experiment. Neither voltage nor amperage gives any very extreme readings, and it is possible to use sensible lengths of wire and get a lot of results.
Results
The first experiment
The experiment repeated
Processing the results
Resistance and averages of both tests:
The cross-sectional area of each wire is:
πr2 = π x (0.2285/2)2 = 0.041mm2 (3 s.f.)
Conclusion
If the length of a piece of nichrome wire is increased, its resistance increases. You can see in my graph that as I predicted, the two look directly proportional: The two increase at the same speed, and at a constant rate. This is shown in the fact that the line on the graph is a straight one.
The graph I got from the main experiment shows the same trend as the one in my prediction. I also predicted that the two would be directly proportional. To a certain degree this is true of my graph, but I have tested some of my results to see how accurate this is.
As you can see, although my results were not exact, the general trend is very clear: Resistance and length of wire are directly proportional to each other. They increase at the same rate.
Explanation
As I said in my prediction:
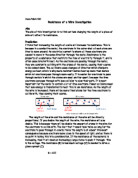
Increasing the length of a wire increases its resistance. This is because in a conductive metal, the electrons in the outer shell of each atom are free to move around. An electrical current is where all these electrons are caused to move in the same direction through the metal. Resistance is the property of a substance that restricts the flow of electricity through it, and is often associated with heat. As the electrons are passing through the metal, they are constantly colliding with the atoms of the metal, causing their course to be slowed down. The collisions cause changes of direction which dissipate energy as heat, which is why more resistant metals heat up more than metals which let electrons pass through more easily. It is easier for electrons to pass through metals in which the atoms are small and far apart, because the free electrons can pass through with less collision to slow their path. It is most important for the metal to contain a lot of free electrons. Fewer collisions mean that less energy is transferred to heat: this is low resistance. As the length of the wire is increased, there will be more fixed atoms for the free electrons to collide with, thus slowing their course.
The length of the wire and the resistance of the wire is directly proportional. If you double the length of the wire, the resistance will also double. This is because there will be double the amount of atoms in the wire for the electrons to collide with. The fact that it would take twice as long for the electrons to pass through in a metal twice the length is of almost irrelevant consequence because electrons move close to the speed of light, and so there is no point in taking this into consideration. If the resistance of the material is increasing, then it will need an increasingly large force to push it through: This is the voltage. The resistance (R) is how much voltage (V) is needed to drive a given current (I).
R = V/I
Resistance (Ω) is also equal to the resistivity of the wire(Ωcm) multiplied by its length(cm), and then divided by its cross sectional area(cm2).
resistance (Ω) = resistance of the metal(Ωcm) x length(cm)
----------------------------------------------------------------------------------
cross sectional area (cm2)
The cross sectional area of the wire is constant, and so is the material I am using. It is only the length that will be changing, so as you can see from the formula, the length and resistance must be directly proportional.
Evaluation
On the whole, I was very pleased with the way my experiment went: I got the results I wanted and proved that my prediction was correct. The variables of the experiment were as follows:
- temperature
- diameter
- type of wire
- length of wire
Because of the nature of these variables, they were very easy to control.
Temperature: the temperature of the room that the experiment was conducted in was always constant so that was not a problem. The other factor which had the ability to cause a change in temperature was the amperage: if this started above my chosen limit of 1 amp then the experiment would have got too hot, resulting in an apparent increase in resistance which was not related to any change in the length of the wire. I avoided this problem using a rheostat, which kept the amperage low.
Diameter: this variable did could not have changed throughout the experiment, and so was not a problem.
Type of wire: again, this was not a variable that could have altered during the experiment.
Length of wire: This was the variable that was to be changed. It was definitely the most difficult to accurately control. Problems arose with the fact that the wire was not entirely straight, and so was very difficult to measure. Also, the wire was attached to a wooden rod, which made it impossible to measure the 35cm point on the wire because it was hidden by a notch in the wood. This made it impossible to accurately measure it. I had to miss this reading out.
Evaluating the accuracy of the Measurements
In general, I was very pleased with the accuracy of this experiment. Having said that, it certainly wasn’t as accurate as it could have been. I would predict that if the experiment were done to a more meticulous standard, the result I have taken would have been exactly directly proportional. The biggest problem I have with the results is the fact that in the repeat test that was done, the results, in general, were quite significantly lower, than in the first. When averaged out however, the results produced points on a graph that were remarkably close to the line of best fit. Many of the points were in fact on the line of best fit. Despite this, there were clear anomalies: The readings for 45cm and 50cm were 3.15Ω and 3.44Ω. These two results are within 15ohms of each other, whereas all the other results are about 30 apart. Another problem with these two results is the fact that the second, 50cm, gave a lower resistance than the reading at 45cm; with all my other results the resistance has been steadily and evenly rising.
There are many factors which could have contributed to these anomalous results:
Accuracy of readings
One major mistake I made when doing this experiment was to read from the wrong scale on the voltmeter. I realized this halfway through the experiment, and had to convert all previous readings back to the correct scale. This was difficult as the scales were difficult to read and compare, and it would have been very easy for me to have misread at least one of the results.
The voltmeter itself had a scale that was very difficult to read. Unlike the ammeter, it was not a digital display: it was just a needle. I am not convinced either that the voltmeter was in very good condition, as the needle did not rest in one exact place. This made it virtually impossible to get an exact reading.
Condition of equipment
The equipment I used for the experiment was not in the best of conditions. In particular, the first power supply we used stopped working halfway through the experiment and had to be changed.
The crocodile clips that were used to connect the nichrome wire into the experiment were very rusty and therefore could have given inaccurate readings.
The nichrome wire itself was very bent and twisted. This made it difficult to measure each of the 5cm intervals with a very great degree of accuracy. There could have been a particularly twisted part of the wire around the 45cm and 50cm marks, which would have caused them to be less accurate.
Carrying out of the experiment
One problem with the actual execution of the experiment was the fact that it was don’t over a period of two lessons. The equipment had to be put away and set up at a later date half way through the experiment. This meant the experiment was not set up with the same equipment as when it was started, and this meant that because none of the equipment available was in very good condition, it could have lead to different results, and a change not in the gradient, but the position of the graph half way through. The 45cm and 50cm results were either side of the two-lesson break. This is why they are so drastically different from the rest of my results. As you can see from the graph of Experimet 2, the gradient on either side of the lesson-break is the same, there is just a gap in between. On the graph of Average Resistance, the anomalous results are not quite so obvious, but there is still a dent around the 45cm and 50cm points.
Evaluating the Conclusion
Despite all the inevitable errors in my results, I am very confident that my conclusion is correct: The length of wire and resistance of wire are directly proportional and increase together. I have been able to give credible reasons why some of my results have been erroneous, and why some are not as accurate as they might have been. I am very satisfied that my results are accurate enough to draw an acceptable conclusion from.
My conclusion not only agrees with my prediction, but also with my scientific knowledge:
Resistance (Ω) is also equal to the resistivity of the wire(Ωcm) multiplied by its length(cm), and then divided by its cross sectional area(cm2).
resistance (Ω) = resistance of the metal(Ωcm) x length(cm)
----------------------------------------------------------------------------------
cross sectional area (cm2)
The cross sectional area of the wire is constant, and so is the material I am using. It is only the length that will be changing, so as you can see from the formula, the length and resistance must be directly proportional.
Improvements
I think that it would have made major difference to my experiment if I had used a computer to monitor the variables. A computer could have given me exact results for voltage and amperage, and would have eliminated any need for reading tricky scales.
Another thing that may have made a difference would have been if the equipment I used had been in good working order. I was not at all happy with the condition of the connecting wires, or with the reliability of the power supply.
I would have liked the wire to be much straighter. It was incredibly difficult to measure accurately in the condition it was in. I am confident that it would have made a big difference to the accuracy of the results if the wire had been properly measured.
Another problem that should have been more carefully tackled was that of the two lesson break. If I had thought ahead, I would have recorded what equipment we used so that we could use the same again. If I had done so, it would have made it easier to prevent the anomalies at 45cm and 50cm.
Improvements – additional evidence
There are many ways in which I would have liked to provide more evidence. It would have been a good idea to do the original experiment three times, because that way, if one set of results was wrong, it would be easier to tell as it would stick out as being different.
I would have liked to repeat the experiment with different metals: to see how they vary, and to check that my prediction is correct for more metals than just nichrome. It cannot be taken for granted that all metals will behave the same as nichrome has done. I would probably use copper and constantan in the same circuit as I used for nichrome. Because I would be changing the metal, I would have to keep all the other variables the same as they were before, and take the same fair-testing precautions. I would not use quite so many different lengths of wire as I did when testing nichrome because all I would want to discover from this experiment was that the trend I found in nichrome is true for all metals. I would expect it to be true, as there is strong scientific proof behind it, which I have explained fully in my prediction: All conductive metals share a similar structure, and their free electrons behave in the same way, so it follows that they should behave the same.