Equipment I will need:
- Electrical wires
- A power pack
- An ammeter connected in series
- A voltmeter connected in parallel
- A wire attached to a meter stick to measure the length accurately
- A power supply (a socket)
- Crocodile clips
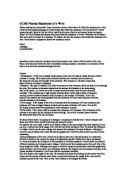
Circuit diagram:
Method
First I will do some preliminary experiments (see further on in this dissertation) these will better inform me of how to best set up my investigation, what the range of results will be and to what degree of accuracy I will need to record my results to.
I will attach the wire into the circuit with crocodile clips the required distance apart (i.e. when I have found out the appropriate lengths from my preliminary results). one clip will remain in place at 0cm and the other will move up the wire to provide my results. Having found out what the range of my investigation will be, I shall start with the smallest value and work my way up the scale recording the values shown on both the voltmeter (to ensure accuracy) and the ammeter.
I will record my findings in a table of results. The column headings will be as follows: ‘Length of Wire’, ‘Voltage’, and ‘Amps’. Having completed the experiment I will repeat it so that my results can be averaged out to get more accurate results and try to eliminate any anomalies.
Having obtained my results I will make a new column headed: Resistance. To work this out I will use the formula R=V/I (resistance = voltage / amps).
From this new column I will draw a scatter graph plotting the resistance of the wire against the length of the wire. Then I shall draw in the line or curve of best fit, which ever is more appropriate. From this graph I will analyse the results and then write a conclusion as to what this investigation has proved or disproved.
Preliminary experiment
To ensure that I am not going to be wasting time recording insignificant results a preliminary experiment will be carried out.
The results were as follows:
From these results I concluded that it was unnecessary to go all the way up to 900mm, as this would be pointless and give no advantage to my investigation. Also, to have the most accurate results it would be best to go up in steps of 50mm, from 50mm to 600mm, as it seems that this area will suffice in providing me with sufficient values.
OBTAINING THE RESULTS
To make my results as accurate as possible I decided to repeat my experiment and take an average of these values, due to limited time I was only able to repeat the investigation once. I will use these results to draw my graph. Also, in averaging repeated results I hope lessen the significance of any anomalies that might occur.
For greater accuracy I will record the results to two decimal places each time.
In the interests of safety I will endeavour not only to keep the power pack at a constant value but also at or below of 2V as at any higher the wire could become unsafe and burn through the wire. Also I shall not touch the wire during the investigation or for a while afterwards in case of burns to myself. I will keep my hair tied back and ensure all equipment is working correctly before proceeding with my experiment.
I have highlighted in red any values that I believe to be anomalies. These results will still be included in my graph as there are more of them that expected and it might be that they follow a trend.
From the graph I am able to deduce that as the length of the wire increases so does the resistance. This result agrees with my hypothesis and the resistance is almost directly proportional to the length of the wire. It appears there is a possibility that eventually the results may gradually turn into a curve rather than a straight line (see further on in my Evaluation).
The atoms of the material of which the wire was made were in a strict pattern and fixed positions. In the space between the atoms were the electrons that separated from the atoms. These were free to move. When the electric force or energy source such as the battery was applied to the wire, it acted on the electrons and drove them in one direction through the wire. This was the flow of current.
It was seen that the resistance increased as the length of the conductor, the wire, increased. This was because as the length of the wire increased a greater force was required to move a greater number of electrons along the wire but as we kept the voltage constant we saw an increase in the resistance.
EVALUATION
My results seemed to be reliable because they followed the theory of ohms law. The points are all close to the line of best fit and it is close to a 45º angle (the results are directly and equally proportional to each other). There were three obvious anomalies but these are almost inevitable in any experiment. I would think that these were caused by the wire heating up as the experiment progressed as most of the anomalies appeared near the end of the investigation and in the second results table. If ohms law is taken into consideration (...providing the temperature remains constant) then it is likely that this caused the anomalies.
I think my results were reliable enough to come to an accurate conclusion. The graph has a clear positive skew with all the points being on, or close to, the line of best fit. However if the anomalies are taken into further consideration it is possible to surmise that the line of best fit may actually be a curve following the anomalies (see dashed line on graph). Further investigation and continuation of the results would be advisable to find out whether this is indeed the case.
During this investigation it was hard to keep the voltage input constant and this may have been another cause of the anomalies. Also the wire kept heating up which was likely to have affected my results.
To improve my investigation or if I was to repeat it I would keep the voltage the same, using a rheostat and adjusting it accordingly could achieve this. I would continue to keep the voltage at 2V, as the wire would become overheated if I didn’t but the readings would become more accurate. It would also be necessary to act upon the problems about temperature. I would go about this by letting the wire cool before I proceed with the next length each time, this is very important due to ohms law. I could not do this before, as I was limited in time. It is also possible that where the bare wire was attached to the meter-stick it could have lost some of its energy if one of the pupils touched it or it was touching the stick. There is no real solution to this apart from to insulate the wire as best as possible.
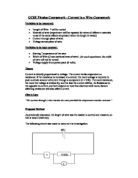
If I were to redo this investigation my new circuit would look like this: (with a rheostat added)
If I were to go on with this experiment and expand it, I would find it interesting to look at how the width of the wire and material the wire is made from affects its resistance. If I had more time I would also carry out more repeat readings to make my results as accurate as possible.
Overall I think this investigation was successful and done to the best of my ability using the equipment provided. It proved that changing the length of a wire does indeed affect the resistance flowing through it in a positive proportional way and although there is room for further investigation into some areas certain limitations have prevented this. I have used ohms law as a guide and related my experiment to it.