- 50 cm
- 75 cm
- 100 cm
-125 cm
-150 cm
Safety:
During the experiments the wire may get very hot. To prevent this I will use a low voltage and I will try not to touch the wire.
Preliminary Work:
To make sure our chosen factor and lengths are suitable for this piece of coursework we are going to carry out a few preliminary tests. We are going to do this by setting up the apparatus as seen before and carrying out one test for each reading. We do this to make sure our chosen lengths of wire are suitable, to check whether the voltage is high, low enough and to see if we have a range of results to get us an accurate results table.
Preliminary Tests:
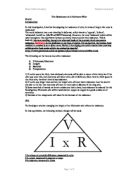
Resistance Ω = Potential Difference in Volts / Current in Amps
It is possible to predict the resistance using resistivity; length of wire and cross sectional area using this is the formulae-
Resistance = resistivity x length
Cross sectional area
R= pl
A
Resistivity for nicrome wire with a diameter of 0.559mm is 1.08 x 10ˉ6
n = length of wire
R = n(1.08 x 10ˉ6)
0.2454 x 10ˉ6
This table shows the resistance readings that we should get in our final experiments. The readings are accurate and have been found using the formulae.
To get the accurate current you have to do another equation:
I = V / R
Current = Voltage / Resistance
Comparing Preliminary results with accurate results:
My preliminary results are very accurate compared with the results that I have calculated. There is only 0.2 Ω difference between the two results so I think that have chosen a sufficient variable, voltage, and I will continue my experiment as planned without making any changes.
My graph shows the resistance of my results compared to the accurate results done by calculation. The two lines are very similar and I think that I have chosen a good variable to give a good range of accurate results without being too difficult.
Prediction:
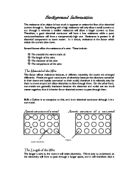
I predict that if the length increases then the resistance will also increase e.g. if the wire length double then the resistance will also double. Electric current is the movement of electrons through a conductor. In this experiment the metal wire Nichrome will be the conductor. So when resistance is high, conductivity is low. Metals such as Nichrome conduct electricity well because the atoms in them do not hold on to their electrons very well. Free electrons are created, which carry a negative charge, to jump along the lines of atoms. Resistance is when these electrons which flow towards the positive collide with other atoms, they transfer some of their kinetic energy. This transfer on collision is what causes resistance. If we double the length of a wire, the number of atoms in the wire doubles. This increases the number of collisions and energy transferred twice, so twice the amount of energy is required. This means the resistance is doubled. When we used the equation Resistance = resistivity x length/cross sectional area, as the length of wire doubled the resistance doubled.
Results
V-Volts
- Amps
Ω- Ohms
I have carried out all the 6 experiments 3 times to ensure I have an accurate and fair set of results. I have only got two anomalies but they are only 0.1Ω out but overall I am happy with my set of results. There is no need to collect any other results. This shows us that we have carried out the experiments correctly and because we have compared them with the accurate results from the equation shown in previous work.
Analysis
I conclude that the longer the wire, the higher the resistance. This is because in a longer wire, there are more wire particles. Electrons colliding with wire particles cause resistance. Where there are more particles electrons are obviously more likely to have collisions, leading to a higher resistance. If we were to put this information into an everyday situation to make it simpler it would read:
A person walks down a street and there are people walking in the opposite direction. The person collides with 10 people walking in the opposite direction. If the same person walks down a similar road but double in length then the person would be expected to collide with 20 people.
The wire with the highest resistance was the longest one – 150cm long. This had a mean average resistance of 6.667Ω. I expected this in my prediction. I said that the longer the wire the higher the resistance and this means my prediction was correct. The wire with the lowest resistance was the 25cm one. This had a resistance of 1.02Ω. The reason for this is that there are not so many particles in a short wire. This means that there were fewer collisions between the electrons and the wire particles. Metals conduct electricity due to a large amount of “free” electrons in their atoms. These free electrons can carry electricity easily. When there is an electric field there the electrons will move from the negative to the positive.
This suggests that length is directly proportional to resistance. This is basically saying if you double the length of a wire, you would expect there to be double the amount of collisions and double the resistance. Likewise, if you triple the wire length there should be three times the amount of collisions and three times the resistance.
So my prediction was very accurate and supports my results. My results have only two anomalies, which are slightly out, and show clearly that as the length of a wire increases, so does the resistance. There is a very clear, steady pattern visible both in the results table and in the graph. On the graph I have labelled several points that make this clear. I have done some calculation to check that if you double the length the resistance doubles. When the length is 50cm the resistance is 2.04Ω and if we half the length to 25cm the resistance becomes 1.02Ω. 2.04 is double 1.02 and this proves that the resistance is directly proportional to its length. Again this proves that my prediction was correct.
Evaluation
I think that the procedure used was fairly suitable, but it could have been done more accurately if we had more time. We just used a crocodile clip to connect the wire at a certain length and the clip itself is a few mm in length. This means that it is impossible to connect it at the exact length that you want. Secondly, the wire was not perfectly straight – it had several slight twists and bends in it, and this would have affected the accuracy of our results. We might not actually have been observing the results for the exact length we intended. The only way we would be able to solve the problem of the bends and twists in the wire is to use a brand new piece of wire and look after it very carefully. We could solve the length problem by using a brand new piece of wire, which starts off at 150cm in length, and we would cut it down to size for each result. This would make our observations closer to the exact length.
Also it was impossible to control the humidity of the room and the temperature of wire. The more current passing through the wire the hotter the wire will become. These will not change the results much so I am sure we have achieved a fair test. I think our results are accurate because we have taken 3 readings for each length and taken the average ignoring and anomalies if we had any. Our results were also made more accurate because we used a fairly wide range of lengths. We used lengths varying from 25cm to 150cm. This way we were able to cope with any anomalous results using a line of best fit.
There were only two anomalies, which only became obvious when we put our results into the graph and when we used the line of best fit. Even though we had two anomalies, which were, only 0.16Ω out at the most our results were reliable and accurate. The two anomalies could have been because the temperature became too high, creating an extra variable to make the test unfair or the humidity could have changed. If the temperature did get too high it would have decreased the current, increasing the resistance. This doesn’t matter because we have used a line of best fit which shows the accurate reading we should have got and which we would have got if our results were correct.
We could use an even wider range of results to increase the reliability of out results, or we could repeat the results more times. For further work, we could think about which material, length, width and temperature wire has the highest/lowest resistance. We could also use different kinds of resistors in the circuit, for example thermistors, so we could see how resistance varied with heat and that resistor or we could even use a light dependant resistor, to see how resistance would vary with that.
To take this experiment even further we could extend the length of wire to get more varied results. I predict that the longer the length off the wire the results will become less accurate because the wire will become difficult to measure and the resistance will also get larger. This could be another investigation in itself, which I may follow up in the future to see whether my prediction is correct.
I have used the equation:
Resistance = resistivity x length
Cross sectional area
We can use this equation to check how accurate our results are.
As you can see I have compared my results with the accurate results from the equation. I have put both of the results from above onto my final graph.
I think my investigation has gone very well and I also think I have gathered a set of accurate, fair results.