- A power pack
- Voltmeter
- Ammeter
- Various lengths of test wire
- Connecting wires
- Crocodile clips
- A metre rule
Method
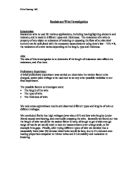
We decided that to obtain enough, reliable results we needed to take readings from lengths of wire from 10cm to 100cm, at 5cm intervals (19 results in all). I took results at 3v, while the other people in my group took results from 5v and 7v. This would hopefully allow us to detect a strong enough correlation, if there is one, to predict other results. The method used is displayed below as a series of bullet points, and as a diagram:
- Plug the power pack into a mains socket
- Set the power pack to the desired voltage - 3v DC
- Plug one of the ammeter terminals into the negative socket using a connecting wire
- Plug a connecting wire into the positive socket and put a crocodile clip on the other end
- Plug another connecting wire and crocodile clip into the other ammeter terminal, with the correct scale selected (depending on length or wire)
- Lay the wire onto the metre rule and clip these two crocodile clips onto either end of the wire, 10cm apart.
- Plug a second connecting wire into the ammeter end crocodile clip and voltmeter
- Take a final wire from the remaining voltmeter terminal and clip it onto the wire 2cm in from the power pack end
- Turn the power pack on
- Accurately collect and record results from the two meters
- Turn off the power pack
- Disconnect the power pack end clip and voltmeter clip
- Move them both 5cm along the test wire, turn on the power pack and collect the next results.
- Carry on to 100cm
It may take more than one person to collect a set of results.
There was one change made to the original planned method that didn’t actually affect my individual results – when working at the higher voltages (that other people in my group worked at) you need to start with longer wire (20cm rather than 10cm) because at the shorter lengths and higher voltages tended to burn out the wire. For other improvements that could be made to the method in future see evaluation.
Fig.1 - Method Diagram
Fair Test Points
Try to make sure all the following are taken into account when carrying out the experiment to make it as fair as possible:
- Make sure the wire is the exact required length
- Take and record results as accurately as possible (use mirrors on meter scales)
- Make sure meters are zeroed before use
- Make sure power pack setting is correct and as accurate as possible
- Use the same thickness and type of wire each time
Safety Points
Observe all the following when carrying out the experiment to avoid injury:
- Do not to touch hot wires (usually high voltages and short wire lengths)
- Take care with the power packs and mains sockets
Null Hypothesis
The change in length of wire will have no effect on the calculated resistance of the wire, or the resistance will decrease as the length of wire increases.
Hypothesis
The calculated resistance of the wire will increase significantly as the length of the wire increases.
Prediction
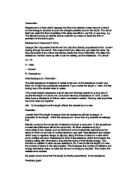
I think the resistance of the wire will increase fairly steadily as the length of the wire goes up, creating a reasonably strong positive correlation. However some of the lower length results may be a bit out of sequence due to slight overheating. I think the calculated resistance will start at almost nothing (at 10cm) and rise quite a lot, to approximately 30 or 40 ohms, at 100cm.
Fig.2 - Sketch graph of my predicted results:
Results
Fig.3 – Results table
This table shows my raw data results collected, along with the calculated resistance of each wire length (R=Volts/Amps).
See separate graph sheet for results graph (Fig. 4).
Graph and Results
As you can see by referring to my Graph sheet (Fig. 4) and results table above, my predictions were reasonably accurate, with a strong positive correlation appearing throughout the range of results. This links the resistance of the wire to the length of the wire, showing that as the length increases, the resistance also increases. This correlation allows a line of best fit and it is possible to predict other results at different lengths.
I think this link can be explained by the fact that resistance is caused by the collisions of the current-carrying charged particles with fixed particles that make up the structure of the material (test wire), so the longer the wire the more collisions take place. This is backed up by the theory of resistivity - the resistance property of the wire. The equation for resistivity is the resistance of the wire, multiplied by its cross-sectional area, and divided by its length (RA/L) – so the length of the wire must affect it’s resistivity and therefore it’s resistance.
Conclusion
This experiment shows that a change in the length of resistance wire directly affects the wire’s resistance.
Evaluation
I think the data collected was generally very accurate and the experiment was carried out to the best of my ability. This is reflected in the results – the graph shows a strong correlation, with only one or two of what could be anomalous points (around the 80cm to 100cm area). Although I don’t really think my range of results was really wide enough, and the graph doesn’t really have enough points on it to form an opinion as to whether or not these few points are real or the result of a poor method or mistake.
I think the method I chose was probably the best option especially as it was not chosen to be as accurate as possible, but to meet the following criteria:
- easy to take results and measurements
- quick and easy to set up, and dismantle each lesson
- cheap
- not particularly time consuming
- not to involve any complex equipment
There are also some specific problems that could have occurred in the method, and possibly caused inaccurate results:
- The wire could have over-heated at low lengths and altered the materials resistance
- The power packs and meters can be quite hard to use accurately
- It is hard to measure the exact length of the test wire
- There may have been faults or slight differences in the wire used
- The ambient temperature may have affected equipment
Although, in my opinion many of the above were unavoidable, especially whilst trying to meet the criteria, and overall I still feel my results are very accurate.
Some of these points lead to possible improvements in the method as well as more questions and possible investigations. For example we could have tried to get the length of wire more exact, as well as possibly trying to control the environment of the experiment, including ambient temperature. It would be interesting to investigate further some of the flaws, for example; the affect of heat on the wire’s resistance, or how the resistance of the wire may change over time or strenuous/continued use.