When setting up the experiment, I shall keep the wire straight by measuring it and taping it down to the workbench, ensuring that the wire is straight and not kinked. To measure the piece of wire, I used a meter rule (1m +/- 1mm). There is no need to take repeat readings for the piece of wire, as it is a one off measurement, but I will have to be as precise as possible as errors in the length could unduly influence the accuracy of my results since it appears in the resistivity formula as a normal value, not squared like the diameter affects the area, and as such it is a much larger number than the area.
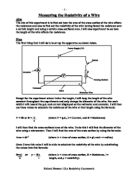
I shall find the resistance of the wire using a standard test circuit as shown on the following page.
WHICH AMMETER TO CHOOSE?
From the diagram above, if the slider was at A, then the current reading on the meter would be maximum. I shall now calculate the maximum current:
I = V/R
I = 1.5/30
I = 0.05 Amps
I = 50 mA
I calculated the maximum current to be 50mA where my wire resistance was 30Ω. I had a choice either to use a 0-100mA ammeter or a 0-200mA ammeter. I chose to use the 0-200mA ammeter and decided that I would take 10 readings approximately every 0.1volt.
LIST OF EQUIPMENT USED:
- 1.5 volt cell
- Potentiometer
- 2 Multimeters (used as both voltmeter and ammeter) -
- 0.75m +/- 1mm length of wire (30 SWG, constantan wire)
- Meter rule
- Wire cutters
- cello tape
- Crocodile clips
- Wire connecters
- Micrometer(mm) – used to measure the diameter of the wire with high degree of accuracy
- Foil – to allow good connection between the crocodile clips and wire
EQUIPMENT RANGE
PROCEDURE
Once I had set up my equipment, I then took readings of the current for different set voltages. I would repeat the experiment another 3 times and then calculate an average current for each set voltage. I shall increase the voltage in uniform steps from the minimum to the maximum. I shall start off with small voltages, and hence small currents, because I don’t want the heating effect of larger currents raising the temperature of the wire unnecessarily. The circuit will be allowed to cool during readings so that the wire’s temperature stays as constant as possible. When doing the calculations, I will not use R = V/I to calculate the resistance of the wire for each experiment carried out because I might at some point get an anomalous result that will be harder to see as I proceed with my experiment. Instead of calculating the resistance using the table, I would average the current readings for each set voltage, and then I shall plot a graph of Voltage (x-axis) and Average Current (y axis). I expect the graph to be a straight line or near enough a straight-line since constantan is an ohmic conductor, and the gradient, m, can be determined using I/V or in other words 1/R. The graph will enable me to check any anomalous results and calculate the resistance.
SAFETY
When working with electricity, there are certain safety issues which need to be considered. One of the main dangers is that if a large voltage is used, the wire can get very hot, and if the hot wire is touched then can cause serious burns, therefore an appropriate voltage must be used. Wire cutters must be handled with care as they are very sharp. The wire itself must be handled with care as the ends of the wire may be sharp when cut using wire cutters.
IMPLEMENTING
Below you can see the final results table of the experiment.
When taking my current readings, I rounded the figures off to 2 significant figures as I thought it was a sensible choice from the scale of my ammeter and voltmeter. I have also stated the units underneath or next to the column headings.
The length of wire used was 0.75m +/- 1mm, which is the exact measured length. This measurement is an important factor, as I shall need it in order to calculate the resistivity.
Above you can see the results for the diameter measurements. I took readings at 6 evenly spaced places along the wire and then calculated an average. The average diameter was calculated to be 0.38mm, which is also an important reading, which will be used to calculate the cross-sectional area.
Now that I have a value for the diameter, I shall now calculate the cross sectional area using the equation πd2/4, as shown below.
Cross sectional area = πd2/4
Cross sectional area = π × (0.38 × 10⁻³m )2 /4
Cross sectional area = 0.113411494 × 10⁻⁶m2
Cross sectional area = 1.1 × 10⁻⁷m2 (2s.f)
This cross sectional area value is an important factor, as it will be used later on to calculate the resistivity.
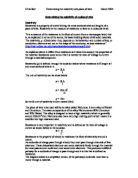
As you can see from the previous page, I have drawn a graph of my results. Both the axis have been labeled stating the correct unit of measurement. Once my points were plotted, I then drew a line of best fit going through the origin.
Using my graph, I shall now find the gradient, m, using as large a Δx/Δy as possible, which will minimise errors.
Gradient (m) = I/V
Gradient (m) = 0.0325/1.0
Gradient (m) = 0.033Ω-1 (2s.f)
M = 1/R
R = 1/m
R = 1/0.033
R = 30.3Ω
I shall now calculate the resistivity using the values I have previously calculated.
R = 30.3Ω
Α = 1.1 × 10⁻⁷m2
L = 0.75m
ρ = RA/L
ρ = 30.3Ω × 1.1 × 10-7m2
0.75
ρ = 44 × 10-7Ωm
CALCULATING ERROR IN ANSWER
Having used the formula ρ = RA/L, I will now need to calculate the error in the values of R, A and L.
% ERROR IN A
A = πd2/4
% ΔA = π/4 × ( 2Δd/d) × 100
= π/2 × Δd/d × 100
= π/2 × 0.001/0.38 × 100
= 0.4%
% ERROR IN L
L = 0.75m ± 0.001
% Error in L = 0.001/0.75 × 100
= 0.13%
% ERROR IN R
1/m = R (best)
1/m = R (worst)
Rbest = 1/0.033 Rworst = 1/0.032
= 30.3Ω = 31.3Ω
ΔR = Rbest – Rworst
= 1Ω
% Error in R = ΔR/ Rmean × 100
= 3.3%
ERROR TABLE
As you can see from the above table, the resistance had the biggest percentage error of 3.3%. Also when measuring the radius there could be a significant error as you have to square the radius to find the cross sectional area.
Now that I have calculated the percentage errors of R, A and L, I shall then calculate the percentage error in the resistivity (ρ).
% Error in ρ = % Error in R + % ERROR IN A + % Error in L
= 3.3% + 0.4% + 0.13%
% Error in ρ = 3.83%
= 4%
ρ = 44 × 10-7 Ωm ± 1.8 × 10⁻⁷ Ωm
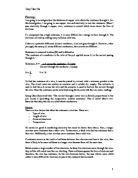
CONCLUSION
To conclude this experiment I can say that having kept the length of wire constant, diameter constant and the temperature constant, I observed that as the voltage increased, so the did the current. When I plotted the graph of voltage and current under these conditions, it turned out to be near enough a straight line. In this case, maybe due to a few systematic and random errors, some of the points were not in line but were slightly out of line. To resolve this problem, I drew a line of best fit which helped me to calculate the resistance.
The final outcome of the experiment and the calculations resulted in me getting a value of resistivity being 44 × 10-7Ωm. When looking at the data book, I found the exact value to be 49 × 10-7Ωm.
Range = 44 × 10-7 Ωm + 1.8 × 10⁻⁷ Ωm = 46 × 10-7 Ωm
44 × 10-7 Ωm - 1.8 × 10⁻⁷ Ωm = 42 × 10-7 Ωm
Range = 42 × 10-7 Ωm - 46 × 10-7 Ωm
From calculating my range, I now know that I was 3 × 10⁻⁷ Ωm away from the true resistivity value. A reason for this difference could be due to temperature not being the same. The experiment was carried out at about room temperature. The temperature was not measured, so a rise in temperature would mean an increase in resistance. The temperature may have increased due to the body heat of people in the room or when allowing current to flow round the circuit, which would heat the wire as the voltage increased, therefore causing increase in resistance. Other reasons to this occurrence may be due to systematic errors or random errors, which I shall now go through.
Sources of Systematic errors:
- “Zero Error” in micrometer screw gauge (solution – add/subtract zero error to measured value of diameter). The diameter of the wire must be measured accurately.
-
Ammeter/Voltmeter not calibrated correctly (solution – ammeters should measure same current through them if placed in series, therefore place two in series. If they read the same value it is likely that they are both calibrated ok and the one I used was fine. If not then a third ammeter could be placed in series to determine which one isn’t calibrated correctly. Likewise, I could check that the Voltmeter was calibrated correctly by measuring the same voltage with a second meter in parallel and the voltage should be the same).
- Length – the uncertainty in my length is the precision limitation of the ruler i.e. +/-1mm.
- Battery – I used a 1.5 volt cell for this experiment. Even though the cell has written on it that it is 1.5 volts, this doesn’t mean it is that exact value. It may have been used several times before and the voltage of the cell may have dropped.
- Crocodile clips used in the experiment may have added resistance to the circuit and therefore add to error
Random errors:
- In my results table the readings I repeated for the current were not always the same – implying that there is a certain random uncertainty in my data so that for any given voltage the current might fluctuate (solution – repeat readings which were carried out)
- Diameter of wire – if this is not constant; the result will be flawed (solution – repeat readings to identify uniformity, which I did). The repeats I took could have shown that the diameter was not the same throughout the wire, again indicating that there is a possibility of random uncertainties in the value of the diameter and hence the cross-sectional area.
IMPROVEMENTS
If I were to carry out this experiment again, I would use more accurate equipment to minimize errors throughout the experiment and therefore making my calculations and final resistivity value as close as I can to the actual value. For example I could use a computer program that controls the voltage so that I can increase the voltage and take readings at set intervals. For the experiment I carried out, the potentiometer I used was on a non-linear scale, so I couldn’t get an exact value from my multimeters when reading the current and voltage. So if I were to carry it out again, I would try using a potentiometer on a linear scale to give exact values for voltage and current readings. I could also use better connections such as soldering the connections, which would also reduce errors in my experiment.