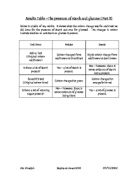
Below is a table of what the concentration of solution (moles) has been transferred into water potential (Kpa). This was done by using a reference graph provided to me by my teacher.
We can see that when equilibrium is reached for both vegetables, the water potential was much higher for potato than swede. This can be justified by referring to part B of the experiment. Starch is insoluble in water and so does not affect the water potential. Sugar, on the other hand, is soluble in water and does affect the water potential. My results in part B showed that potato had lots of starch and little sugar. This would explain the reason why potato had such a low water potential due to the little sugar found in the tissues. My results in part B also showed that swede had lots of sugar and little starch. This is why swede has such a negative water potential due to the fact the sugar is soluble in water and so affects water potential.
The changes in mass of both potato and swede are due to the movement of water molecules into or out of the cell. According to my part A of my results, when potato was put into a weak/pure sucrose solution, it gained in mass. For example, at 0.2 moles, the potato gained in mass by +0.8%. When the potato was placed in a strong sucrose solution, it loss mass. For example, 0.4 moles, the potato decreased in mass by –10.2%.
Swede followed a similar pattern (that they both decrease in mass, the higher the concentration). However, it took a stronger solution to make it lose mass. The swede did not decrease in mass until it got to 0.8 moles. Even at 0.8 moles there still was not a significant loss as it only decreased in mass by –3.7%.
In part A experiment, the swede was always more negative than potato. This is due to the results found in part B (that swede had a lots of sugar). The more solute a solution is, the more negative the water potential is. Pure water has a water potential of zero. Once a solute is added, for example sugar, the more negative the solution becomes. Swede has more solutes than potato and so has a more negative water potential, as my results showed.
EVALUATION
In this experiment, there are several sources of error that have shown up on the graph. Theses are known as anomalies. Anomalies are points on a graph that do not follow the line of best fit. These could be caused by a difference in room temperature, human error, potato and swede not all being the same size, and many others. We try and keep errors to a minimum, by keeping variables the same apart from the one we are testing. If we can manage to keep variables the same, then there will not be as much error in the experiment. Any anomalies on my graph, have been highlighted and below are some possible causes of error.
The main problem of the experiment was the cutting of the tissues. This caused the most difficulty because of the precise measurements were required. We were required to cut the tissues at 0.5 cm by 0.5 cm by 7.0 cm. The equipment we were given did not cut either the potato or swede easily. This led to a huge inaccuracy between my vegetables. It is so important to have both potato and swede to have the same dimensions. This is because if the dimensions of the tissues are different, then the ratio between surface area and volume are different too. This could cause errors in the results because the lower the surface area, lowers the amount of osmosis possible to take place at any one time. To over come this problem, there could be a machine that can cut the potato and swede exactly to those dimensions.
On the instructions we were given, we were told, “…the strips of tissue should be blotted dry and reweighed.” When plotting the tissues, pressing too hard or lightly could cause error. Pressing too hard or lightly would affect the reweighing of the tissues. This is because too much or too little of the solution had been squeezed out. A possible solution for this problem could be to have a machine to put equal pressure onto each sample of tissue. This would ensure that each tissue has the same amount of solution squeezed out of it.
When I came back to reweigh my tissue samples, I found that many of them had stuck together. This reduces the surface area of the tissue and prevents osmosis from happening. If this experiment was done again, maybe I could put dividers into the petri dishes. Hopefully this would avoid the tissues from sticking to each other. Also, a similar problem that occurred was that the tissues sometimes floated. The problem was not solved during my experiment. All I could do was make sure that the tissues were covered as much as they could be.
Room temperature could have affect the rate at which the experiment took place. If the room temperature was slightly higher or lower than normal, this could cause inaccurate results. When temperature is higher, the particles have more energy and so move faster. If particles are moving faster, this means that osmosis is happening faster than at normal room temperature. To solve this, doing the experiment in a temperature controlled room.
If all the criteria above were met, the experiment would be fairer and the result would be more reliable. However, some of the above solutions to over come the problems may not be suitable. For example, buying a machine to put equal pressure on the tissues. This costs extra money, which may not be practical for the school to buy.
Although there are a few anomalies and possible reasons for error, looking at my results, I believe that they are fairly reliable. I can tell they are reliable by looking at my results and comparing potato A to potato B and swede A to swede B. For example, for potato, at 0.2 moles potato A had increased by +1.2% and potato B had increased by +0.3. These two figures are very similar and so I believe they are reliable. Doing the experiment twice also increases the reliability of the experiment because you are getting a range of data to justify what you are explaining. Maybe, next time this experiment is done, it could be repeated four or five times. The more times you do an experiment, the easier it is to assess reliability. Also, anomalous results do not have as much impact on the average. However, repeating an experiment several times can become tedious for the person doing it.
I believe that equilibrium for potato was reached at 0.22 moles and for swede, I believe it was reached at 0.64. However, I cannot be absolutely sure of this statement. This is because this figure came from a graph that was a line of best fit. Therefore, it is based on interpretation of where the line crosses the x-axis. I can be sure that potato’s water potential is closer to zero than swede. Swede is more negative than potato because swede has more solutes than potato and therefore it is more concentrated.
To prove my line of best fit is correct, I could test the tissues at more precise concentration. For example, I could test potato in every concentration between 0.2 and 0.4 moles because I believe it is between these two points that equilibrium is reached. So, I would test potato in solutions of these moles 0.24, 0.28, 0.32, 0.36, and so on.
Another experiment that could be done is comparing two vegetables that are closer in relationship. Potato and swede are like two opposite (one has a lot of starch the other does not). Using two vegetables in the same family, for example, normal potato and sweet potato.
In conclusion, despite any anomalies that occurred, my results are still valid and reliable. However, they can be improved by having even more control over the variables that you do not wish to change. This experiment is open to a lot of other further deeper experiments. These other experiments can help validate any explanation given or put forward. They can also make my data more reliable.